


Bitcoin is going strong and has crossed the major resistance level of $8000 for the first time since May 2018.
Bitcoin Cash has broken the barriers at $820 and $840 resistance levels and continues to show a stronger uptrend.
Bitcoin (BTC/USD)
Price Analysis
- High: $8341.83 USD
- Low: $7695.99 USD
- Major Resistance Level: Near about $8400
- Hourly MACD: Placed in the Buy region.
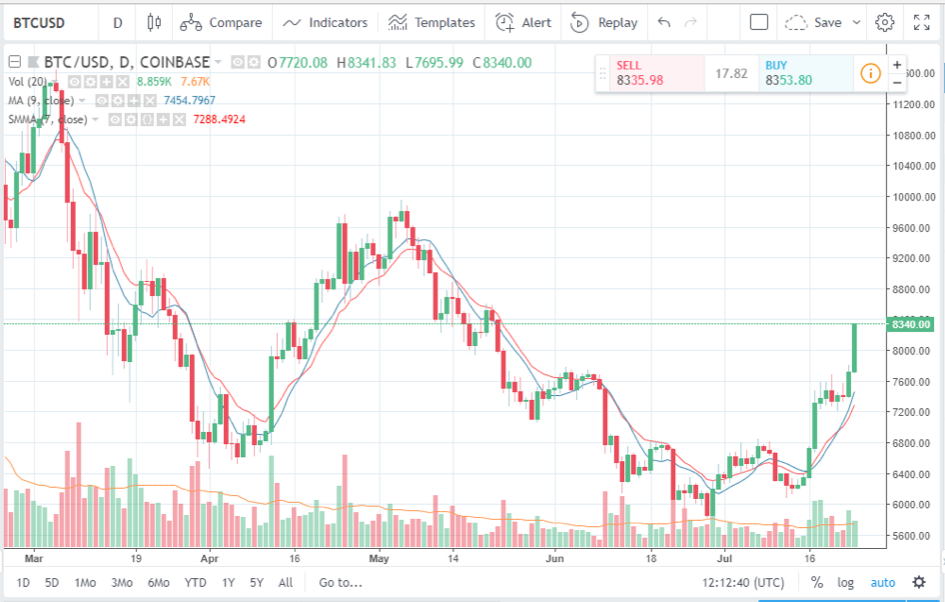
Bitcoin has jumped from yesterday’s high of $7809.00 to a whopping high of $8341.83 against the US Dollar so far today. From 14th July 2018 onwards, the price of Bitcoin (BTC) has been experiencing an uptrend largely with short-term pressure on the sellers. Since almost the beginning of January 2018, Bitcoin and many other cryptocurrencies market had been affected by the drop in prices. So, this surge experienced by the crypto coin today can be expected to bring in more investors and create a stronger pressure on the buyers. This will keep the BTC/USD pair in the green and the pair will then continue with the uptrend.
At the time of writing, the price of Bitcoin (BTC) shows nearly $8340.00 against the US Dollar. (As of 24th July 2018). The moving average (blue line) is currently marking at 7454.7967. This too indicates that the price of the BTC/USD pair has more or less strengthened itself near the $7500 level. It is to be seen whether the BTC/USD price will reach the major resistance level near about $8400. If Bitcoin finds support above $8050 then, it can be expected to provide anchorage in case there is a trend reversal.
Bitcoin Cash (BCH/USD)
Price Analysis
- High: $876.4 USD
- Low: $772.0 USD
- Major Resistance Level: Near about $870
- Hourly MACD: Placed slightly in the Buy region.
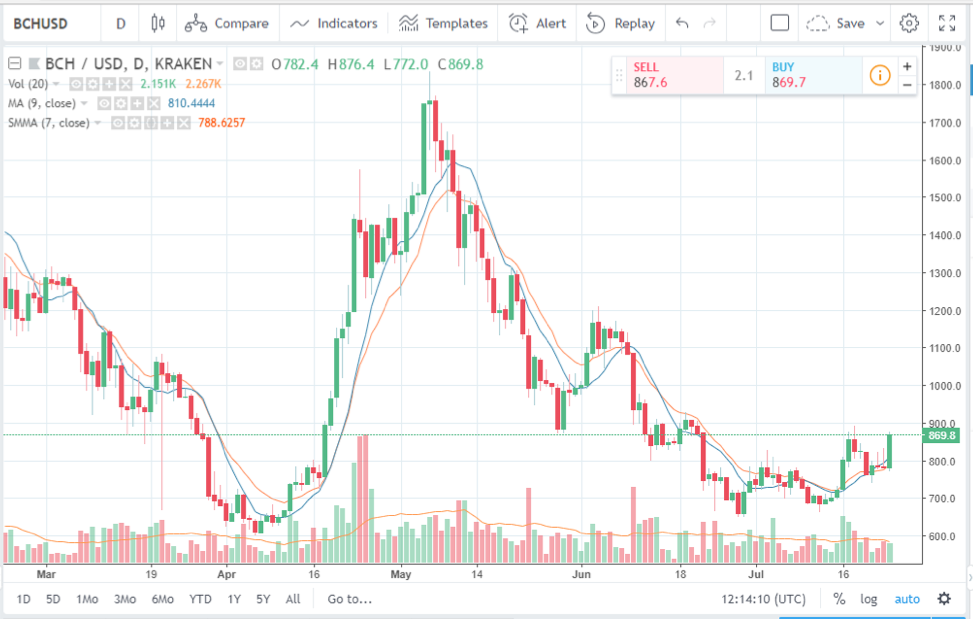
The BCH/USD pair had been featuring a short-term uptrend again from 13th July 2018 and continued till 17th July 2018. After that, as observed from the chart, there has been a pressure on the sellers and Bitcoin Cash had experienced a price drop. On 20th July 2018, the BCH/USD pair had experienced a drop to $760.6 from the previous day’s high of $803.4. On 22nd and 23rd the market was also bearish for Bitcoin Cash.
Today, again the price of BCH has surged so far to $869.8 against the US Dollar. (At the time of writing, as of 24th July 2018) The moving average (blue line) is currently marking at 810.4444. This has created a pressure on the buyers that make the technical analysis from Trading View to place the crypto coin slightly in the Buy region. The market for BCH/USD pair at the time of writing is bullish and a comparatively large green candle has formed beside the past two days’ short bearish red candles. Tomorrow again a pressure may form among the sellers and push the price down a little bit, as of now the uptrend is going quite strong. It may also happen that the price action of BCH/USD continues to feature a stronger uptrend. Let’s wait and see for the moment.
Happy Trading~
For the latest cryptocurrency news, join our Telegram!
Disclaimer: This article should not be taken as, and is not intended to provide, investment advice. Global Coin Report and/or its affiliates, employees, writers, and subcontractors are cryptocurrency investors and from time to time may or may not have holdings in some of the coins or tokens they cover. Please conduct your own thorough research before investing in any cryptocurrency and read our full disclaimer.
Image courtesy of Pexels
Charts courtesy of tradingview.com
The post Bitcoin, Bitcoin Cash Price Analysis: Trading in the Green appeared first on Global Coin Report.
Read more at https://globalcoinreport.com/bitcoin-bitcoin-cash-price-analysis-trading-in-the-green/

Globalcoinreport.com/ is author of this content, TheBitcoinNews.com is is not responsible for the content of external sites.
Our Social Networks: Facebook Instagram Pinterest Reddit Telegram Twitter Youtube


