From a technical perspective, several of the most highly liquid and highly traded cryptocurrencies have begun to hint at some interesting new potential on their charts over recent days.
This type of action is not definitive at this stage – there’s very little confirmation. However, the game here is a probabilistic one that involves close scrutiny of past and present chart patterns mixed with identification of an advantageous risk:reward statistical edge.
From that standpoint, both Bitcoin (BTC) in Ethereum (ETH) are clearly worth a closer look at present as both coins are starting to show off some very interesting bullish potential provided key levels continue to hold firm.
Bitcoin (BTC)
Price Analysis:
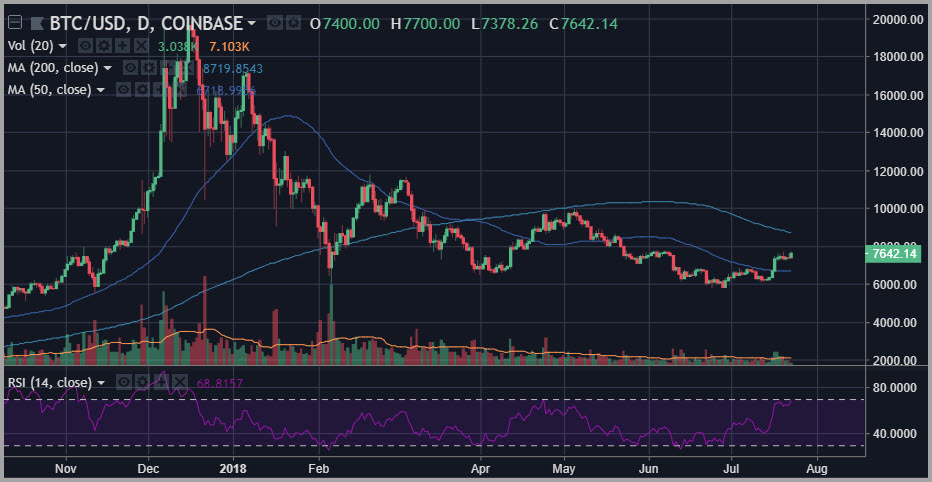
- High: $7700
- Low: $7378.26
- Major Resistance Level: $7750
- Hourly MACD: Strong Upward Momentum

Naturally, everyone knows Bitcoin (BTC) has been in a serious bear market trend over the past seven months. However, recent action suggests that the potential for some form of upward inflection should be taken seriously.
First off, we have begun to see signs in recent days of the potential for the affirmation of the formation of a higher low at key support. This higher low pivot stands in relation to the late June dive down well beneath the $6000 level in BTC.
The recent hold at that same level over the last few days suggests that the recent break back above 50-day simple moving average and the $7000 level over recent days is a major inflection the market context.
As noted above, given the direction of trend on the chart over the larger time frame, this is hardly confirmation, but it is very promising from a technical standpoint. In other words, the action over the past week clearly suggests that Bitcoin (BTC) is beginning to show a set of signals that demand greater focus from active traders over coming days, and the clear possibility that the bear market has run its course.
Ethereum (ETH)
Price Analysis:
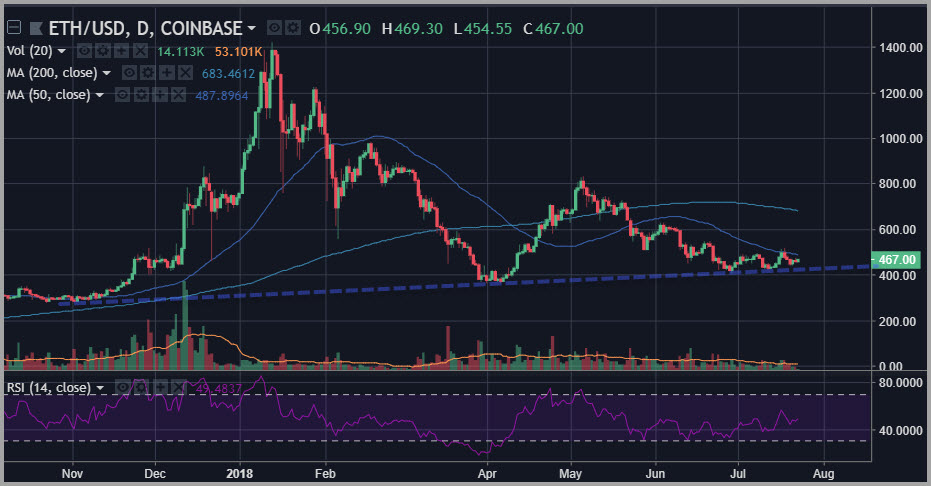
- High: $469.30
- Low: $454.55
- Major Resistance Level: $500
- Hourly MACD: Emerging Upward Momentum

Ethereum (ETH) has been positively divergent to Bitcoin (BTC) over the past several months, meaning that it has been slightly outperforming on a swing for swing basis in relationship to the other clear and key events shown on the chart, internally speaking.
And this continues to bear itself out.
As we noted above, Bitcoin (BTC) has been showing some interesting signs of the possibility of a bullish higher low. In fact, Ethereum (ETH) is posting perhaps even more convincing signs of the same phenomenon, and the potential for a break back above the $500 level over the very near term.
In terms of identifying the other side of the equation – risk – one need only look at the trendline formed over the lows made in this coin over the past 3 to 4 months.
While some interesting potential bullish signals may be coming into place for ETH, one getting involved here on a speculative technical basis certainly would not want to stay involved through a move back underneath that trendline.
The post Bitcoin (BTC) Ethereum (ETH) Price Analysis – Is This Do-or-Die Time? appeared first on Global Coin Report.
Read more at https://globalcoinreport.com/bitcoin-btc-ethereum-eth-price-analysis-is-this-do-or-die-time/

Globalcoinreport.com/ is author of this content, TheBitcoinNews.com is is not responsible for the content of external sites.
Our Social Networks: Facebook Instagram Pinterest Reddit Telegram Twitter Youtube


