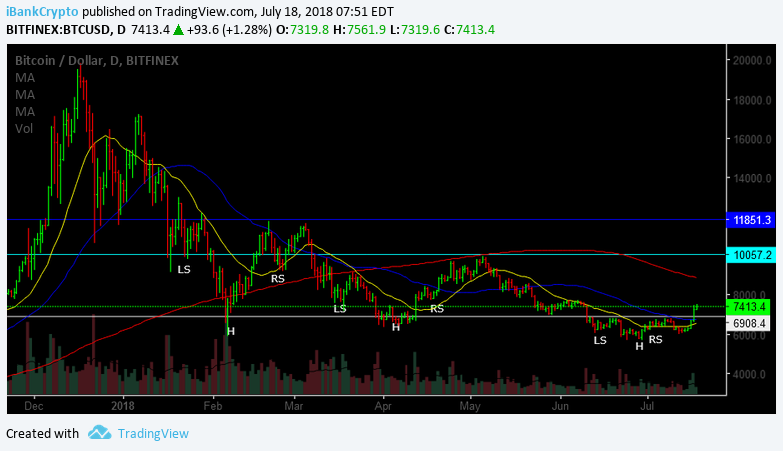
After two (2) prior unsuccessful attempts at completing inverse Head-and-Shoulders (H&S) formations which prevented Bitcoin (BTC) from breaking out of its long downward malaise over the past six months, BTC was finally able to go top-side of its recent neckline (6900 level), with conviction, in yesterday’s trade and in the process, completing its most recent H&S pattern as well as kicking-off the counter-trend rally that we had been anticipating as well as preparing our readers, for such a potential turn of events.
While six-times a charm was the ticket for Vinny (Joe Pesci), the character in the Film “My Cousin Vinny”, three-times a charm it was for Bitcoin.
In addition to the successful completion of the inverted H&S pattern and perhaps more importantly, we are now experiencing the large counter-trend rally that we have noted/referenced in several (HERE and HERE)) of our recent writings when we stated, “While the daily time-frames continue to portray potential for lower levels, not everything is bleak. When zooming-out to both the Weekly and perhaps more specifically, the Monthly time-frame/s, we’re nearing an important inflection point from which we suspect that the bleed lower subsides/pauses and in turn, results in a massive counter-trend rally that may begin as early as the next 2-3 weeks. Nonetheless, we’ll cross that bridge when we arrive and in the meantime, continue to keep readers of Global Coin Report apprised of the technical landscape and what may be in store ahead. 6/27/18″
Now that we’re off and running and the party has commenced, let’s take a look at the Charts to see what may be in store as we move forward.
As we can observe from the Daily chart above, we can see that BTC has gone top-side of the neckline (white horizontal line) located at the 6900 level, a level that we have attempted to direct readers attention to for some time as being a potentially critical inflection point.
In addition, we can also see that BTC not only cleared the 6900 level but did so with ease and conviction. Furthermore, BTC now finds itself trading above both its 20 (yellow line) as well as its 50 (blue line) day moving averages, which portrays a favorable technical posture from both a short and intermediate-term duration. Although BTC remains well below its 200 SMA (red line) on the daily time-frame and requires further work, such business is for another day.
Nevertheless, both the short and intermediate-term time-frames are both constructive and encouraging from a technical standpoint.
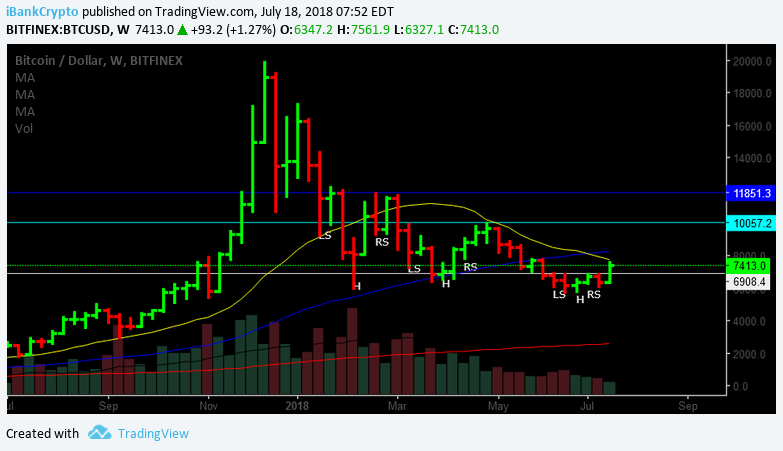
Moving out to the Weekly time-frame below, we can witness that BTC is presently trading beneath both its 4WK (yellow line) as well as its 10WK (blue line) moving averages, yet appears set to test its 4WK moving average in the not too distant future. Whether it is able to clear and recapture the hurdle, requires further monitoring.
Needless to say, the recent action of BTC, as well as the entire cryptocurrency space, has been a welcome relief and while we’re not certain as to whether the recent lows (5700) prove to be “A Bottom” or “The Bottom” is rather premature to declare just yet.
With that in mind, both investors/traders may want to utilize the following levels as a guide as well as evidence/clues with respect to direction moving forward.
Based purely on the inverted H&S pattern, the measured move for BTC suggests a price objective in the 7800-8000 zone. While the move can certainly overshoot or come-up a tad light, we’ll have to await further cards from the deck to be revealed.
Nonetheless, if, at any time in the days ahead, BTC can clear the large volume red bar high of 6/10/18 located at the 7500 figure, such accomplishment, should it materialize, would likely trigger the next move into higher ground into the noted 7800-8000 zone. On the flip-side of the coin, previous resistance at the 6800-6900 zone should now provide for durable support.
While both investors/traders patience and perseverance have certainly been put through the test throughout this long arduous bear market of the past 6-7 months, embrace the present rally as it’s been well overdue and deserving for those who have endured.
Happy Trading~
For the latest cryptocurrency news, join our Telegram!
Disclaimer: This article should not be taken as, and is not intended to provide, investment advice. Global Coin Report and/or its affiliates, employees, writers, and subcontractors are cryptocurrency investors and from time to time may or may not have holdings in some of the coins or tokens they cover. Please conduct your own thorough research before investing in any cryptocurrency and read our full disclaimer.
Image courtesy of Pexels
Charts courtesy of tradingview.com
The post Bitcoin (BTC) Technical Analysis – Three Times Is Indeed A Charm – Countertrend Rally Underway appeared first on Global Coin Report.
Read more at https://globalcoinreport.com/bitcoin-btc-technical-analysis-three-times-is-indeed-a-charm-countertrend-rally-underway/

Globalcoinreport.com/ is author of this content, TheBitcoinNews.com is is not responsible for the content of external sites.
Our Social Networks: Facebook Instagram Pinterest Reddit Telegram Twitter Youtube


