


As we continue to trace out the recent corrective move that has been dominating the cryptocurrency complex over the past eight days, we are beginning to test key support levels that represent important signals about the fate of the current chart pattern we see shaping the charts for many large market cap coins.
Below, we are going to take a close look at the charts for Bitcoin (BTC) and Tron (TRX), noting the key dynamics in play, any directional signals they imply, and the important levels to watch on both sides of the tape.
Bitcoin (BTC)
Price Analysis
- High: $7108.6
- Low: $6914.8
- 24-Hour Volume: $3.88B
- 7-day Percent Change: -14.66%
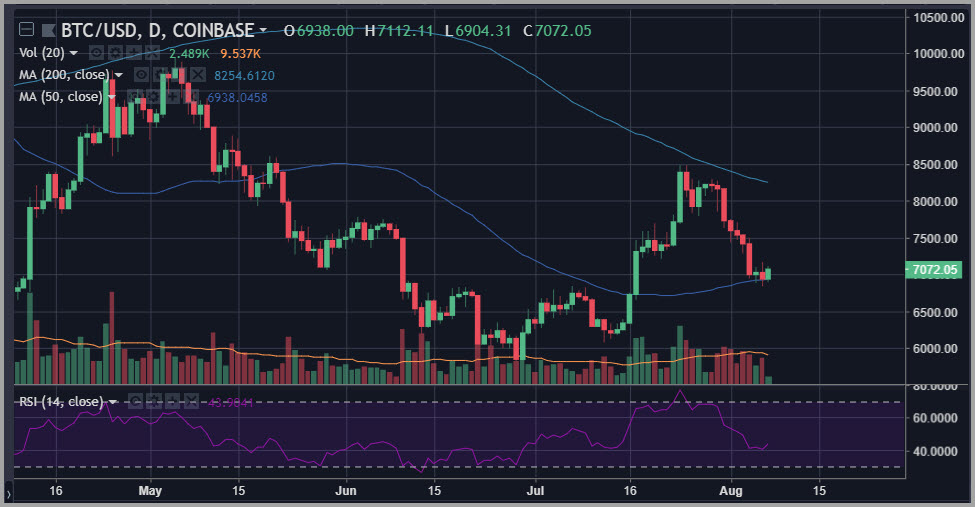
Bitcoin (BTC) has been steadily pulling back following its test very near the 200-day simple moving average in the middle of last month around the $8500 level.
The pullback that we are currently navigating in Bitcoin (BTC) has made its way all the way back through the moving average channel to test key support at the 50-day moving average, which crosses the chart just under the $7000 level.
Importantly, BTC volume has been rising over the past month as excitement builds back into the space during the bounce and weak hands are now busy tossing their positions overboard for fear of tying themselves down to a sinking anchor. That is the type of mentality that can often spawn a bounce at support like this.
At this point, key support sits below at the $6800 level, should lower lows appear for the trend on the hourly chart.
The MACD on that chart right now is actually favorable and supportive for a possible move back above the $7000 level as the histogram sits neutral and both the MACD line and signal line are below the belt.
Tron (TRX)
Price Analysis
- High: $0.029626
- Low: $0.028829
- 24-Hour Volume: $118.83M
- 7-day Percent Change: -18.31%
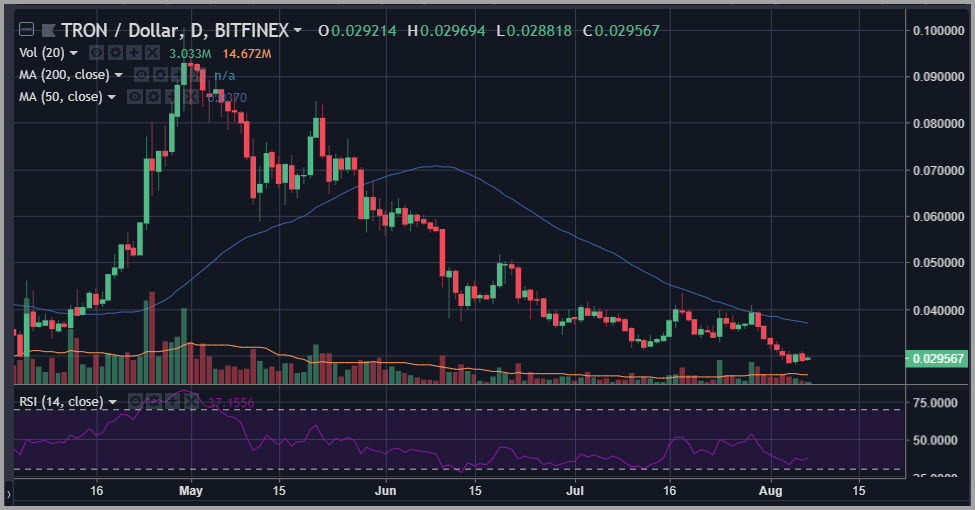
Tron (TRX) has been one of the weakest of the large market cap coins over the past week, diving nearly 20% in that time, and taking out a number of key support levels.
We may be building a case for an oversold bounce simply by dint of a seller exhaustion dynamic given the magnitude of the decline. In short, TRX has probably been one of the toughest picks in the space this summer, and there may be no shortage of individuals still contemplating giving up on it if the downside momentum persists.
However, at the same time, Tron (TRX) also has one of the strongest areas of technical support currently in play, with major lows covering the area where it currently trades – including major pivots in February, March, and April of this year.
The most important level below is clearly the $0.025 level, which could come into play if we see another couple days like the action we saw last week.
Happy Trading~
For the latest cryptocurrency news, join our Telegram!
Disclaimer: This article should not be taken as, and is not intended to provide, investment advice. Global Coin Report and/or its affiliates, employees, writers, and subcontractors are cryptocurrency investors and from time to time may or may not have holdings in some of the coins or tokens they cover. Please conduct your own thorough research before investing in any cryptocurrency and read our full disclaimer.
Image courtesy of Pexels
Charts courtesy of tradingview.com
The post Bitcoin (BTC) Tron (TRX) Price Analysis: Huge Support Levels Now in Play appeared first on Global Coin Report.
Read more at https://globalcoinreport.com/bitcoin-btc-tron-trx-price-analysis-huge-support-levels-now-in-play/

Globalcoinreport.com/ is author of this content, TheBitcoinNews.com is is not responsible for the content of external sites.
Our Social Networks: Facebook Instagram Pinterest Reddit Telegram Twitter Youtube


