Bitcoin has pushed considerably higher since falling to $10,400 this week on news that BitMEX was being charged by the CFTC. The cryptocurrency wicked as high as $10,760 just a day ago as buyers re-enter the market.
The cryptocurrency may be “losing some steam” on an extremely short-term basis, though.
Bitcoin May Be Losing Some Steam
Bitcoin has pushed considerably higher since falling to $10,400 this week on news that BitMEX was being charged by the CFTC. The cryptocurrency wicked as high as $10,760 just a day ago as buyers re-enter the market.
The cryptocurrency may be “losing some steam” on an extremely short-term basis, though. One trader shared the chart below, showing that the cryptocurrency is on the verge of losing the daily and weekly volume-weighted average price:
“$BTC looking like it is losing some steam here. Not a good thing considering the stair-stepping structure below that is prime for a stop cascade. I am short right here. Looks to be the first time a move is setting up worth taking. Lose Daily + Weekly VWAP and its on.”
He elaborated that Bitcoin losing those levels could trigger a move back to the local lows in the $10,400 region.
Chart of BTC's price action over the past day or two with analysis by crypto derivatives trader Cantering Clark (@CanteringClark on Twitter).
The concern mentioned by the aforementioned trader has been echoed by other analysts.
As reported by Bitcoinist previously, one trader noted that there is a confluence of signs indicating that Bitcoin will soon decline. The signs mentioned as medium-term trend signals that should dictate in what direction BTC moves in the coming days.
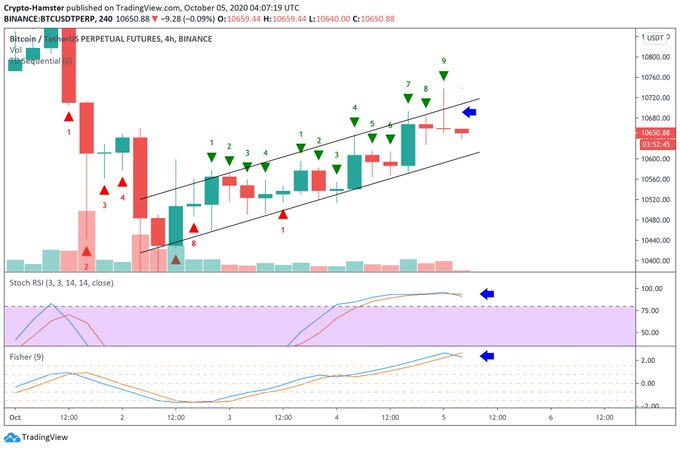
Signals mentioned by the trader include the formation of a “sell 9” Tom Demark Sequential candle on the four-hour chart, a rejection at the top of an ascending channel it has been trading in, and the formation of a CME futures gap.
Three-quarters of all CME futures gaps fill within the week they are formed, data from a market research company has shown. This suggests that at minimum, Bitcoin will move back towards the $10,550 region this week.
Chart of BTC's price action over the past few days (since the start of October) with analysis by crypto trader Crypto Hamster (@CryptoHamsterio on Twitter).
Chart from TradingView.com
Macro Trends Still Favor Growth
Bitcoin may be facing down some short-term bearish signals but macro trends still favor market growth.
Dan Tapiero, co-founder of Gold Bullion International and DTAP Capital, recently stated that structural deflation is poised to boost BTC.
“Massive structural deflation in Europe supports Bitcoin. Causes European Union real interest rates to geo up even as nominal rates are negative. Crushes legacy European Union banks. European Central Bank drags feet and maybe [its] hands [are] tied. Dollar falls as real rates rise faster in the European Union than in the US.”
Tapiero has said that the cryptocurrency could hit $50,000-100,000 in this cycle.
Featured Image from Shutterstock
Price tags: xbtusd, btcusd, btcusdt
Charts from TradingView.com
Bitcoin May Be "Losing Some Steam" as Crucial Support Levels May Break

Bitcoinist.com is author of this content, TheBitcoinNews.com is is not responsible for the content of external sites.
Our Social Networks: Facebook Instagram Pinterest Reddit Telegram Twitter Youtube


