


Influential Bitcoin traders are moving their funds into spot exchanges as the cryptocurrency rallies towards $16,000.
Ki-Young Ju, chief executive of data aggregation service CryptoQuant, said in a tweet that All Exchange Inflow Mean, an average of bitcoin deposits across the global cryptocurrency trading platforms, spiked above 2 BTC on Friday. The metric alerted about an increased activity among the so-called “whales,” pointing to a sell-off in the short-term.
“I’d recommend to keep on eyes on this chart [below] to time when to sell BTC,” said Mr. Ju.
Bitcoin exchanges’ fund balance recovers after the overnight price rally. Source: CryptoQuant
The analyst’s bearish outlook took cues from an early price-inflow correlation. The Bitcoin inflow into exchanges last touched 2 BTC on October 28. On the same day, the BTC/USD exchange rate slipped by 3.62 percent.
In retrospect, analysts treat a surge in exchanges’ BTC balance as bearish. That is because traders typically store their crypto holdings offline. They transfer it to exchanges only when they want to trade their bitcoin tokens for alternative cryptocurrencies or fiat money.
Similarly, when the BTC outflow from exchanges picks momentum, it indicates an increasing “HODLING” behavior among traders.
“Danger Zone”
Mr. Ju confirmed that All Exchange Inflow Mean was indeed a “danger zone” but reaffirmed that it would not lead to a Bitcoin price crash.

A lower Exchange Whale Ratio points to a sustained uptrend in the long-term. Source: CryptoQuantThe analyst concluded bullishly after checking on the 90-day moving average of the Exchange Whale Ratio. The readings on it were low even after a spike in BTC deposits, leading Mr. Ju to say that traders with a long-term bullish outlook are “safe from mass-dumping.”
The Exchange Whale Ratio represents “the relative size of the top 10 inflows to total inflows by day of each exchange.” In short, it shows that fewer whales are moving their bitcoin funds on a 90-day timeframe.
What’s Next for Bitcoin
The short-term outlook for the Bitcoin market remains cautious.
Technically, the current BTC/USD exchange rate is above normal levels, according to its daily Relative Strength Indicator (RSI), a barometer to measure the magnitude of its recent price changes. Reading above 70, the RSI determines Bitcoin as an “overbought” asset.
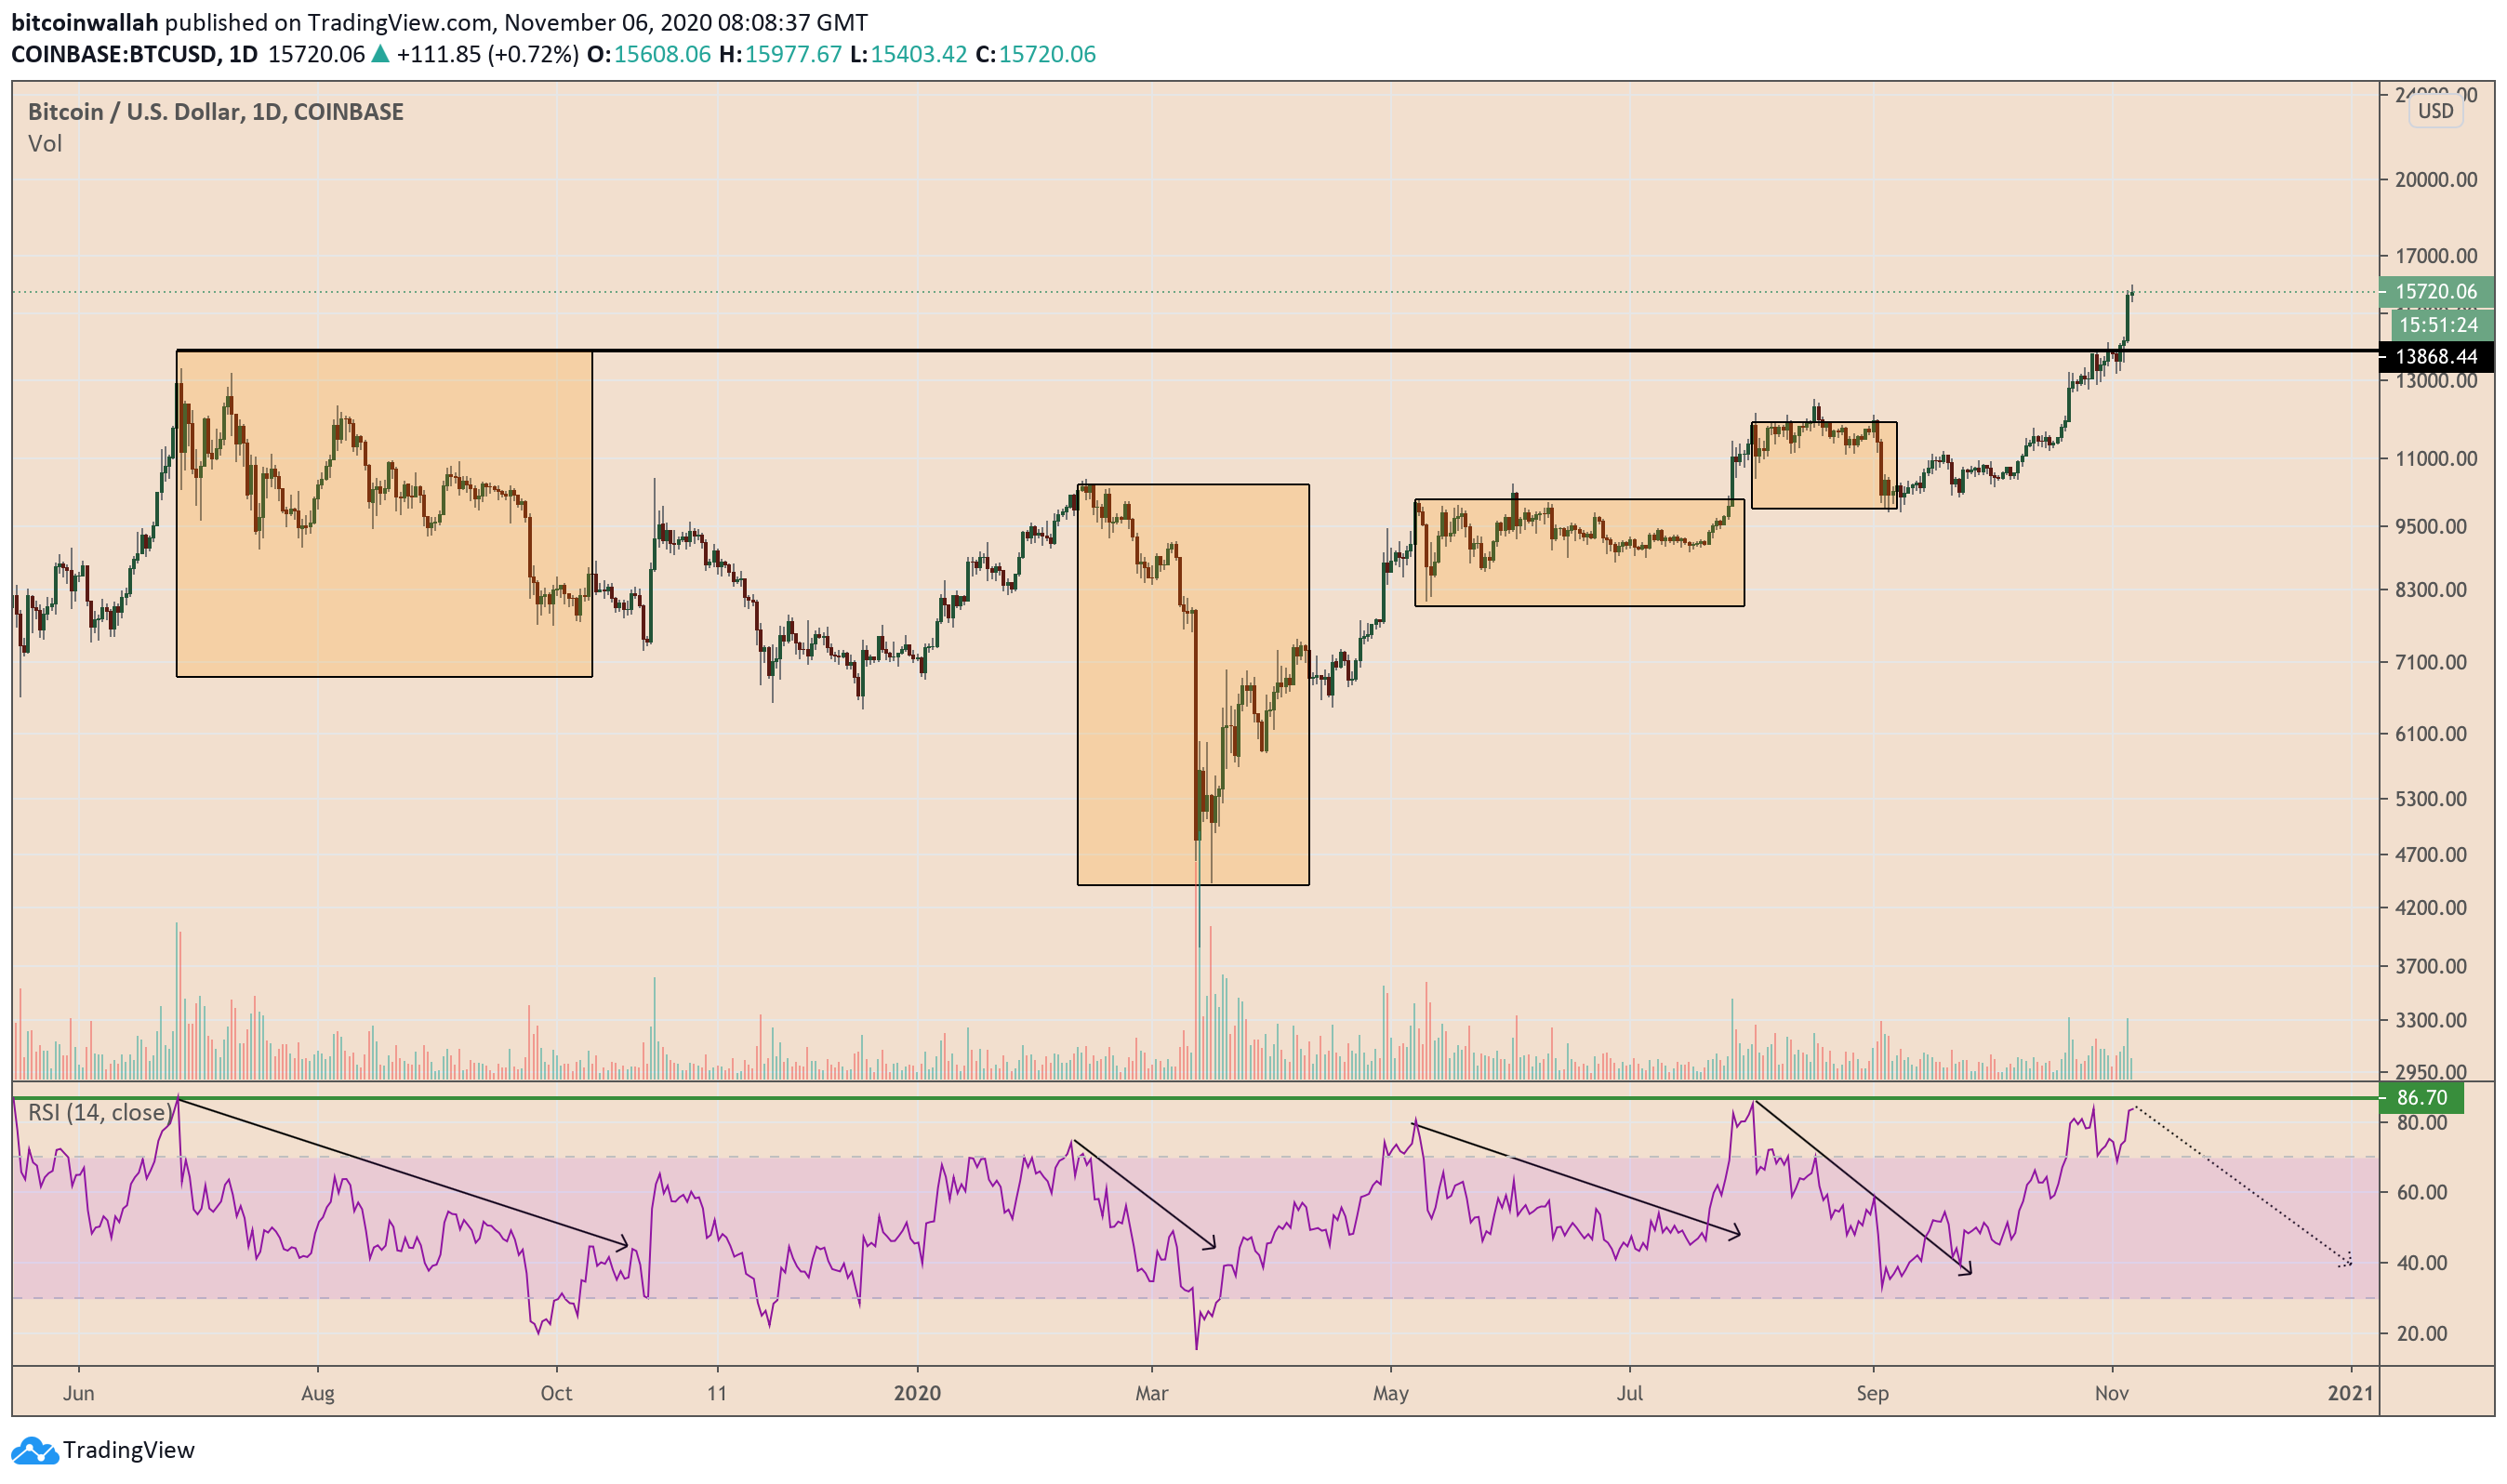
Bitcoin price-RSI correlation in recent history. Source: BTCUSD on TradingView.com
According to its recent follow-ups from an overbought zone, that amounts to a correction in both the Bitcoin price and its momentum. Therefore, the cryptocurrency could fall back after testing $16,000 as resistance to either form local support or extend its decline towards deeper downside levels.
“We’ve had 10 straight green candles on the 4-hour chart,” said one trader. “If this starts pulling back, there isn’t much below us till 14.2 or so.”

Bitcoinist.com is author of this content, TheBitcoinNews.com is is not responsible for the content of external sites.
Our Social Networks: Facebook Instagram Pinterest Reddit Telegram Twitter Youtube


