

A potential Wyckoff Distribution phase is under way as bitcoin continues to climb on shaky ground. Days after having a strong $1,000 climb and nearly reaching $6,000 on most exchanges, we saw a strong rejection of the upper limits of the market as it plunged $600 over the course of a few short hours. Let’s take a look at the macro pattern and draw a few similarities to the Wyckoff Distribution schemes:
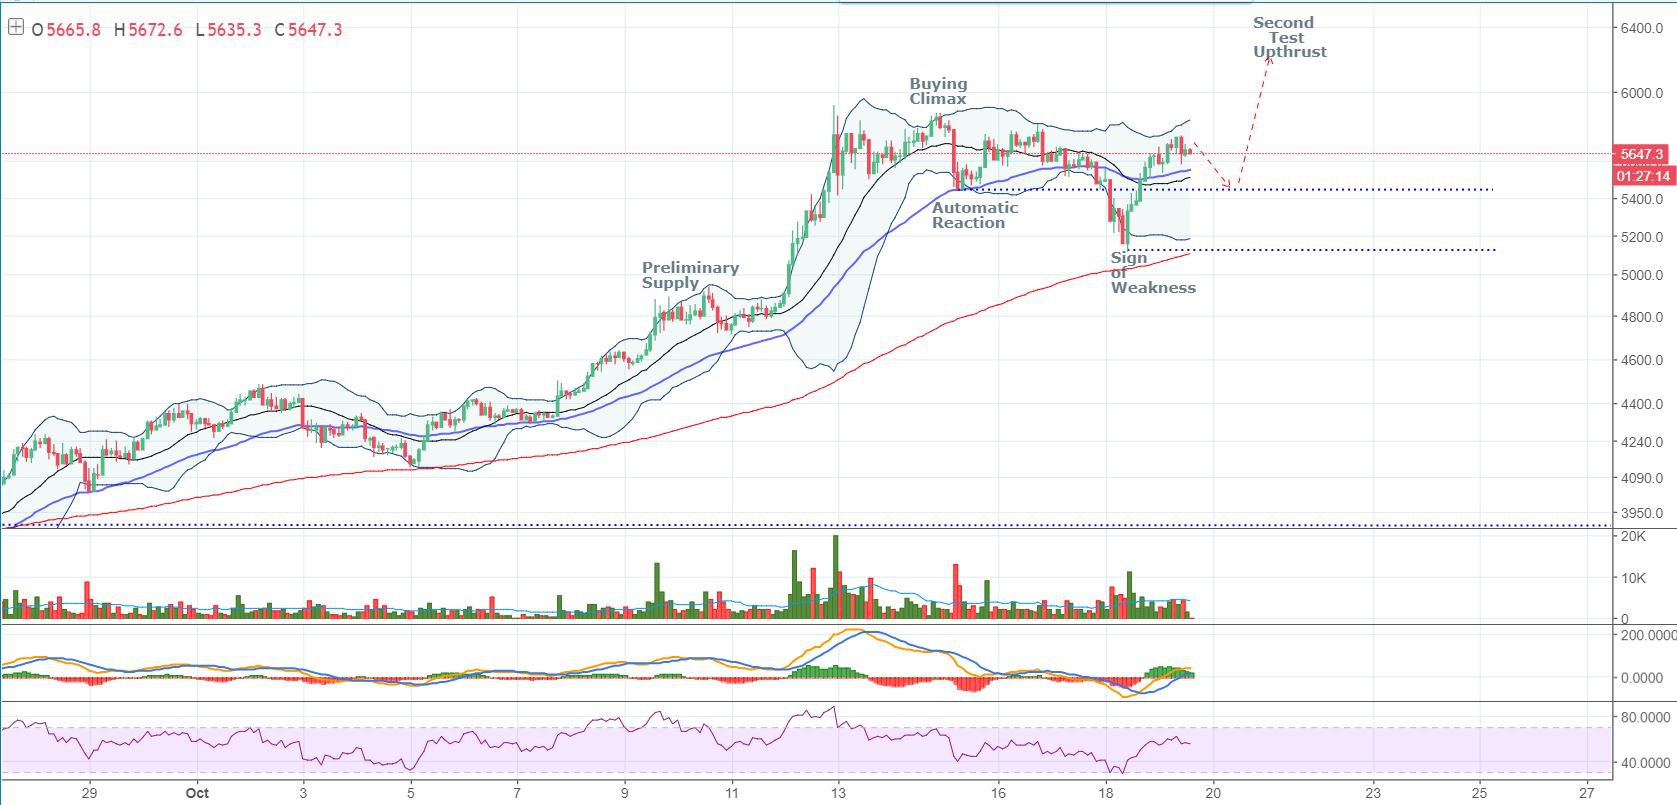
Figure 1: BTC-USD, 2-Hour Candles, Potential Wyckoff Distribution Phase
In order for the current distribution phase to be reliable, there are certain milestones the market must reach. As shown above, we previously established a point of Preliminary Supply, a strong Buying Climax, a knee-jerk reaction into an Automatic Reaction low, and a weak rally that ultimately led to a Sign of Weakness that pushed us down several hundred dollars. The rebound from this low was strong and occurred on very high volume. However, over the length of the rally post-sign-of-weakness, the volume has begun to taper as the momentum indicators are showing signs of bullish exhaustion as it finds its local high at around the $5,700 values.
One of the following milestones for the Wyckoff Distribution phase is one last dip as it tests the previous support around the Automatic Reaction low. As of the the time of this article, the current market trend is showing signs of bearish divergence on the 120-minute candles. Zooming in closer, we can see clear signs of a potential small reversal:

Figure 2: BTC-USD, 30-Minute Candles, Waning Momentum
Both the RSI and MACD are showing signs of bullish exhaustion throughout the length of this rally. Any pullback will likely be supported by the Automatic Reaction support level. Historically, this has been a strong point of support and is made more evident on the 60-minute time frame:

Figure 3: BTC-USD, 60-Minute Candles, Strong Support Zone
The 200 EMA on the 1-hour candles is historically a great support level and provides traders a pulse on the market health. As of the time of this article, the 200 EMA is lining quite nicely with the support zone offered by the Automatic Reaction Zone. A test of these price levels would take a strong push to break and hold below. If the price continues through the Wyckoff Distribution, we can expect a test of the 200 EMA and a subsequent bounce triggering an Upthrust to new all-time highs. As mentioned in the last BTC-USD market analysis, we are trending along a macro channel:

Figure 4: BTC-USD, 1-Day Candles, Macro Ascending Channel
An Upthrust in this potential Distribution Phase would have a price target testing the upper channel in the $6,200–$6,300 price range.
Summary:
-
A potential Wyckoff Distribution Phase is playing out.
-
If the Distribution Phase plays as expected, we will see a test of the 200 EMA and a subsequent spring to new all-time highs.
-
If an Upthrust to new all-time highs occurs, we can expect a price target in the $6,200s.
Trading and investing in digital assets like bitcoin, bitcoin cash and ether is highly speculative and comes with many risks. This analysis is for informational purposes and should not be considered investment advice. Statements and financial information on Bitcoin Magazine and BTC Media related sites do not necessarily reflect the opinion of BTC Media and should not be construed as an endorsement or recommendation to buy, sell or hold. Past performance is not necessarily indicative of future results.

Bitcoinmagazine.com is author of this content, TheBitcoinNews.com is is not responsible for the content of external sites.
Our Social Networks: Facebook Instagram Pinterest Reddit Telegram Twitter Youtube


