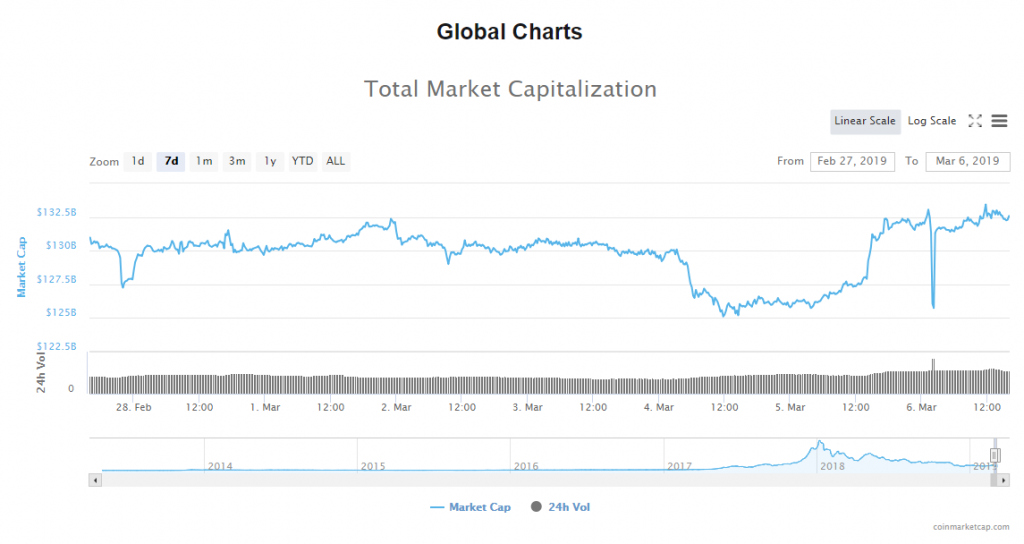
From yesterday’s low at $125,74B the evaluation of the cryptocurrency market cap has been increasing and came up to $133,444,141,476 at its highest point today but has retraced since and is currently sitting at around $132,620,529,922.
On the global chart, you can see that the evaluation came up to the levels of from which the last decrease was made to the downside and countered resistance there as it is struggling to keep up the upward momentum and has been stopped out there with the pattern looking corrective we are now most likely going to see a rejection at those levels which would set the market for a cooldown, but this could only be a temporary retracement before further upside.
The market is in green today with an average percentage of change among the top 100 coins in the last 24 hours ranging around 1-1.6%. The biggest gainers are in double digits like Bitcoin Gold with an increase of 20.44%, ABBC Coin with an increase of 23.47%.
Bitcoin’s market dominance has been decreasing consequently and is currently sitting at 51.6%.
On both charts, you can see a large dip but since there is none on the charts of the major cryptos I believe it is only a calculation bug.
Bitcoin Price Analysis BTC/USD
From yesterday’s low at $3786 the price of Bitcoin has increased by 5.2% measured to its highest point today when the price spiked up to around $3982.2 at its highest point today.
On the hourly chart, we can see that the price has increased impulsively after previously retesting the baseline support and the horizontal support at around $3783, and as I’ve counted 4 waves another minor increase would be expected before the upward movement ends. this
The price broke out from the descending trendline which served as resistance and was retested numerous times with every retest ending as a rejection which caused the price to fall down to its support levels, but now that the price found to support it managed to make up for the loss made as the price is around the same levels as it was when it corrected sideways prior to the drop.
As the price encountered resistance and has come above the 0.618 Fibonacci level it is sitting in a tight range which is why we are now seeing the formation of another minor sideways correction which is according to my count the 4th wave out of the five-wave move to the upside.
If this range gets broken to the upside we are to see further interactions with the upper resistance out of which the $3994.4 level is the most significant one and as the interaction still hasn’t occurred we are likely to see if before another minor retracement starts.
It is still unclear how this correction should be counted so it is still unclear whether this current upswing is the part of the same correction or not. If the Intermediate WXY correction ended we are now seeing the development of the trend continuation to the downside, but if the correction got prolonged by two more wave X and Z we are seeing the development of the second wave X.
The difference between the counts is in incorporating the first impulsive decrease in the correctional count. If it is the start of the impulsive move it would be the 1st wave and the now seeing correction taking place as the second wave out of the five-wave impulse. But if we are seeing the second intermediate wave X it would mean that the initial drop should be accounted.
In either way, I would expect to see more downside for the price of Bitcoin when this increase ends as in either way the price is going to down even if we are seeing the development of the second wave X.
If the price continued its upward trajectory we could see the price of Bitcoin up to around $4062, slightly above the horizontal resistance at $3994.4 where the price is quickly peak above and enter the seller’s territory which would then propel it in a downward trajectory again.
But if the now encountered resistance proves to be strong we are to see more downside for the price of Bitcoin below the baseline support and the horizontal support at $3783.
Market sentiment
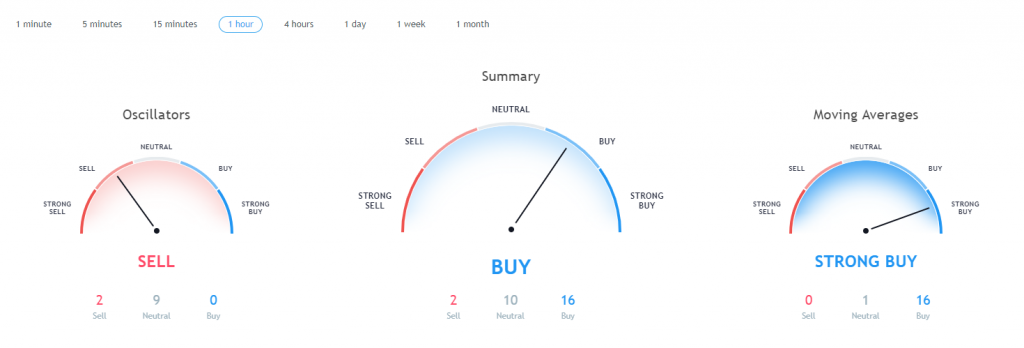
Bitcoin’s hourly chart technical are signaling a buy.
Pivot points
S3 2943.1
S2 3464.3
S1 3688.7
P 3985.5
R1 4209.9
R2 4506.7
R3 5027.9
Conclusion
Ever since the initial drop in last Monday when the price of Bitcoin came down by more than 10% we have seen sideways movement.
Yesterday the price of Bitcoin ended its downfall from the range in which the majority of the sideways movement occurred and today we have seen an increase back to the same to resistance levels of the sideways range which could mean that the range in still in play and is the part of the came correctional movement.
Elliott Wave count implied that we are to see more a decrease after the Intermediate Y wave ended which is what happened but as the price action looks more corrective then impulsive I don’t believe that we are seeing the start of the expected trend continuation. Instead, more likely we are seeing the prolongation of the mentioned Intermediate correction which we will soon validate.
If the price of Bitcoin continues moving upward it could reach the area around $4062 which would be another increase of 3.55%. before a retracement occurred or it could be stopped out sooner as the horizontal resistance level at $3994.4 hasn’t been interacted. In either way, after the increase ends another downtrend will develop and from it we are to see which could get validated.
I would expect to see the price of Bitcoin at around $3868.5 which is the lowest support level of the sideways horizontal range if the price is to continue moving up, but if the price continues moving lower than that the most likely scenario would be that we are indeed seeing another move to the downside.
The post Bitcoin Price Prediction: A Lull Before The Move Above $4k? appeared first on Blockonomi.

Blockonomi.com is author of this content, TheBitcoinNews.com is is not responsible for the content of external sites.
Our Social Networks: Facebook Instagram Pinterest Reddit Telegram Twitter Youtube


