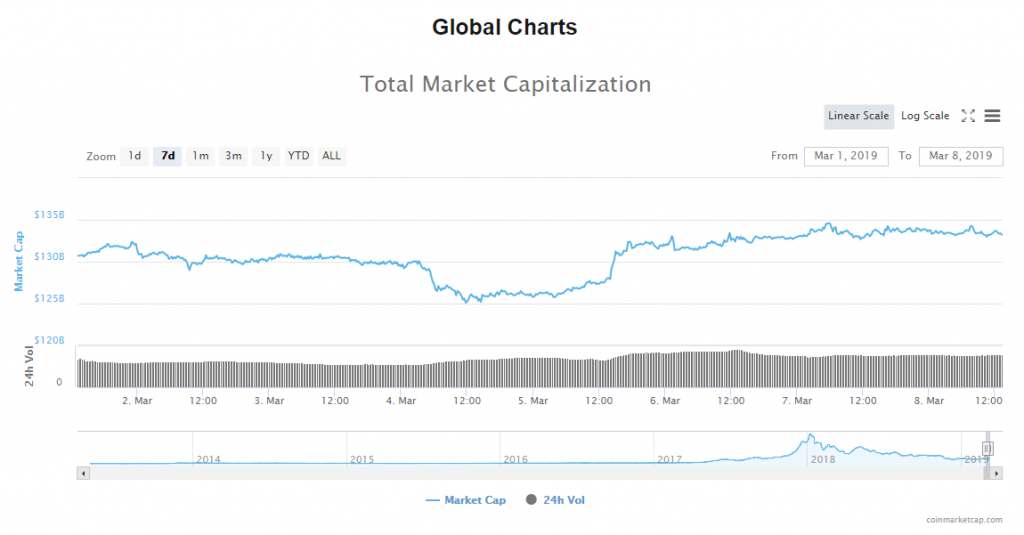
Over the last couple of days, we have seen the market stagnating in the evaluation as it came up to around $134B area and found resistance there as the bullishness was stopped out.
On the global chart, you can see that the evaluation has started to slowly shift trends as it has at first fallen out but is not forming a minor downtrend creating an ark around the level from which it previously fell to the downside.
The market is in mixed colors today with an insignificant percentage of change in the last 24 hours among the top 100 coins, as the evaluation hasn’t changed much from yesterday’s open around $133B, as its currently sitting at around $133,2B.
Out of those who have shown the biggest percentage of change and are in green are Enjin Coin who increased today by more than 59%, followed by Aurora with an increase of 48.23%, and there are those around 10% range like Chainlink and Icon.
Bitcoin’s market dominance has been hovering around the same levels but with a slight increase as its currently sitting at 51.68%.
Bitcoin BTC/USD
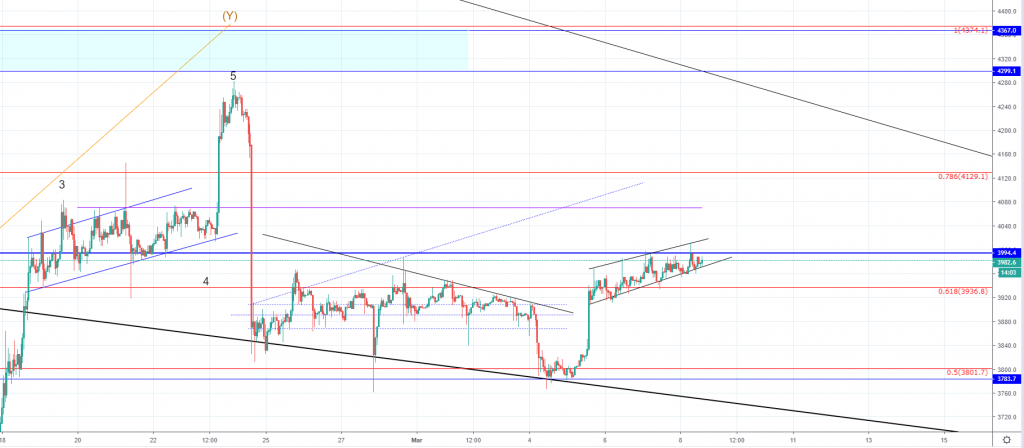
On yesterday’s open the price of Bitcoin was $3954 and from there the price increased at first to $3987, then fell to $3945 from where it increased again to $3994.4 and then fell again to $3968.
Looking at the hourly chart you can see that the price action continued creating minor higher highs and higher low as it is still in the ascending channel but now an interaction has been made with the horizontal resistance at $3994.4 so now we are going to see if the price will be rejected or will we see further increase.
The price is above the 0.618 Fibonacci level which serves as a support but the tight horizontal range in which the price action is currently in is making it hard to keep up the bullish momentum which is why we are seeing this ascending channel around the mentioned levels as it is most likely a cluster in which the buyers are the sellers are struggling for control.
The buyers are currently in control as the price is moving in an uptrend but this might lead to exhaustion after which the sellers’ could start gaining control which would then lead to a breakout to the downside.
The other possible scenario would be that the sellers are going on a temporary halt as they would be willing to sell at a better price which is why they could stop defending the range which would remove the current resistance the price is facing.
If this logic gets put into practice we are going to see another impulsive increase to the upside with the price potentially exceeding the prior high at $4261 although the next significant resistance point is at $4063 which needs to be broken after which the 0.786 Fibonacci level at $4130 serves as resistance.
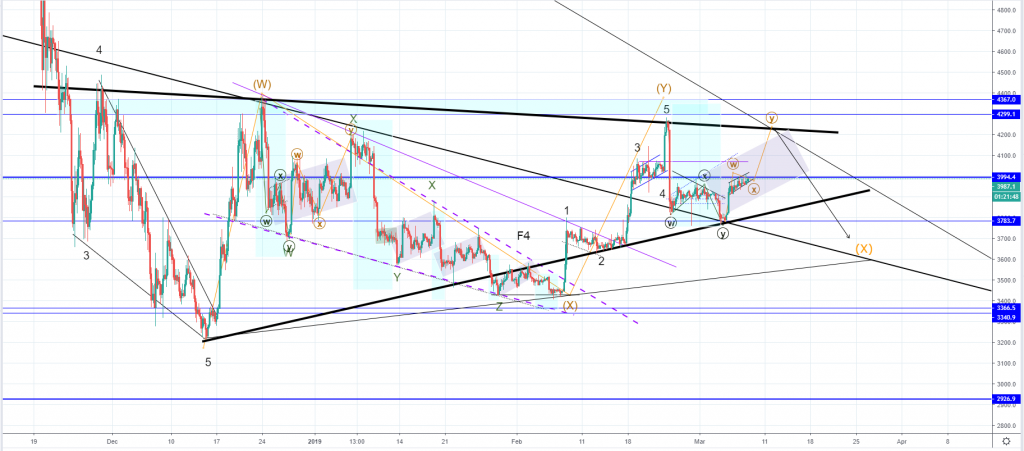
Zooming out to the 4-hour chart you can see my projection in which the price increases from here on another impulsive move to the upside which would be another 3 wave correction similarly to what we saw after the intermediate W wave ended in a Minor WXYXZ correction. This fractality could provide further indication that we are going to see the correction prolonged by two more waves out of which we are in that case seeing the formation of the second wave X.
If this is true then the price of Bitcoin is set to interact with the intersection between the falling wedge resistance and the correctional ascending triangle’s resistance point which would be at around $4235 before getting rejected by that resistance knot which would propel the price for the further correctional decrease.
Market sentiment
Bitcoin’s hourly chart technical are signaling a strong buy.
Pivot points
S3 2943.1
S2 3464.3
S1 3688.7
P 3985.5
R1 4209.9
R2 4506.7
R3 5027.9
Conclusion
As the price of Bitcoin has continued moving upward in an ascending channel and has reached the expected resistance at $3994.4
We are now going to see if the price is going to get rejected or will the buyers catch more momentum needed for a breakout to the upside.
If a breakout to the upside occurs the first significant resistance point would be at $4068 but if the price does get the needed momentum it will most likely continue past it on a minor retracement with the first optimal target being at the $4235.
After which more downside would be expected to $3500 if we are seeing the second wave X from the prolonged correction.
The post Bitcoin Price Prediction: Breakout Could Take us Past $4200 appeared first on Blockonomi.

Blockonomi.com is author of this content, TheBitcoinNews.com is is not responsible for the content of external sites.
Our Social Networks: Facebook Instagram Pinterest Reddit Telegram Twitter Youtube


