


From Friday’s low at around $135B the evaluation of the cryptocurrency market cap has been increasing and is currently sitting at $139,266,680,247.
The evaluation went a bit higher coming to $141,519,172,433 at its highest point over the weekend which was on Saturday.
Since the evaluation encountered resistance around its upper horizontal resistance level around the vicinity of the prior high a retracement has occurred with the evaluation currently starting to move in a downward trajectory as the minor high was a lower one.
Trade Bitcoin with the Cryptohopper Platform.
On the global chart, you can see that the evaluation moved to the upside in an ascending channel and since it came to its most upper resistance point we could expect to see a pullback at least to the support level of the channel.

The market is in mixed color today with an average percentage of change among top 100 coins ranging around 1.2%. Bitcoin’s market dominance has been declining and is currently sitting at 50.8%.
Bitcoin BTC/USD
On Friday’s open the price of Bitcoin was $3948 which is the lowest point the price has been since Friday as the price started increasing from there and came up to $4158.2 at its highest point on Saturday which was an increase of 5.32%. Since the high, the price has pulled back to $4045 which was yesterday’s low but today the price came up to $4120 at its highest point as another attempt has been made for the price to continue its upward trajectory.
As the attempt failed and the price hasn’t exceeded the prior high another retracement has occurred to around $4050 level which is serving as a minor horizontal support level around which the price is currently moving in an attempt to establish some support and is currently sitting at $4060.
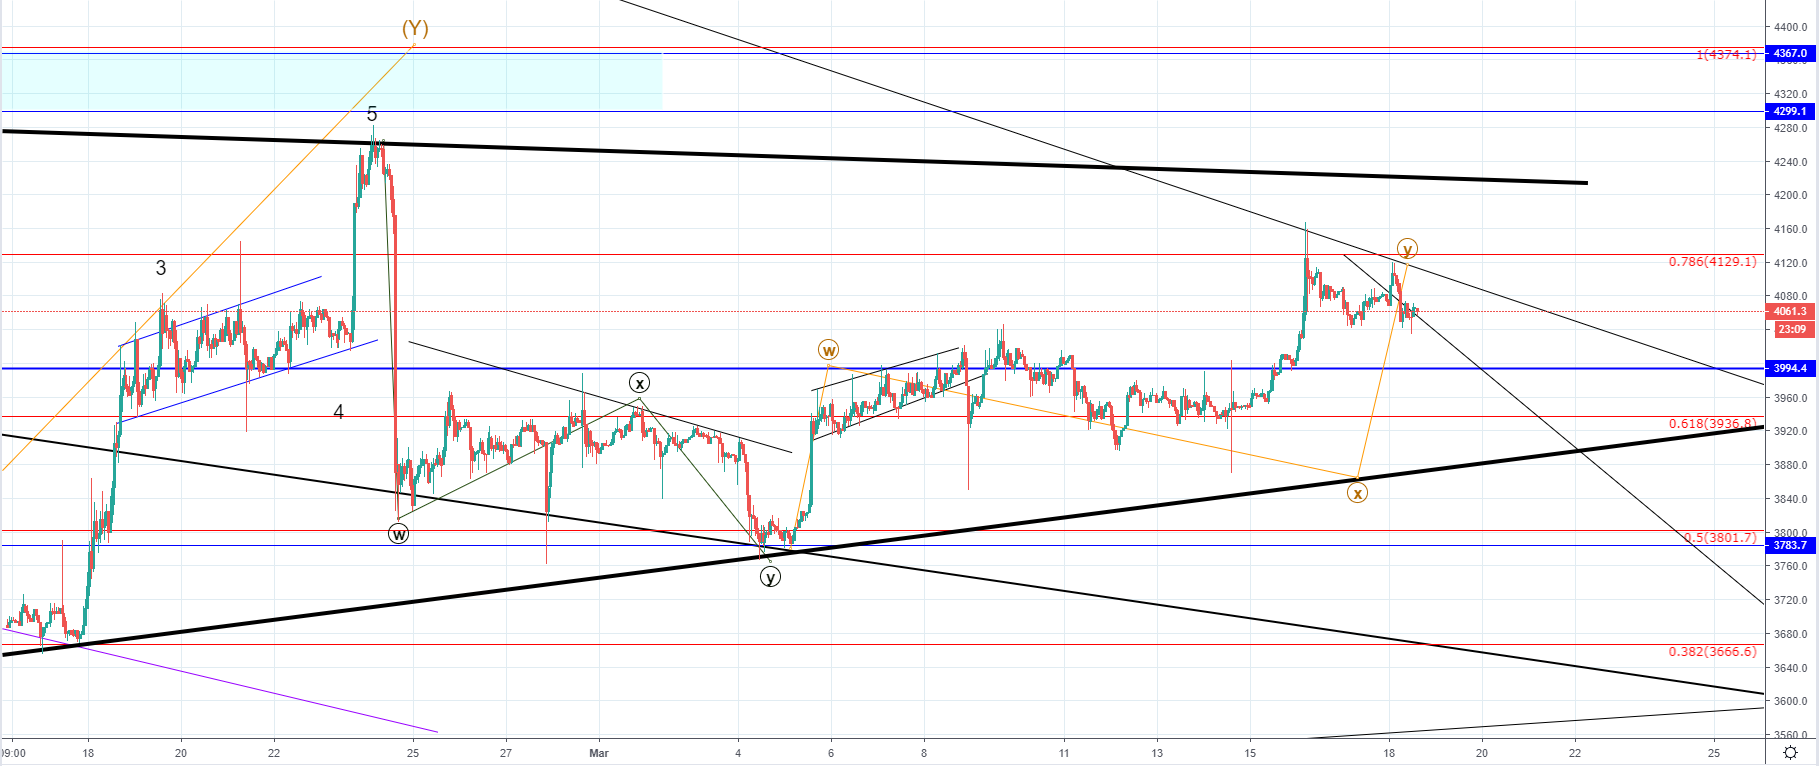
On the hourly chart, you can see that my projected scenario got validated as the price increased to the expected levels around the intersection between the 0.786 Fibonacci level and the falling wedge resistance line.
According to my count, this upswing is corrective in nature as it is the second Minute correction after the price previously impulsively increased to the upside.
If this is true then the price is now heading for a third correction to the downside or the third impulsive move if from when the increase ended we are seeing the start of the trend continuation to the downside as the Intermediate WXY correction ended.
This upside movement would be the second wave out of the impulsive five-wave move to the downside or a third correctional wave if the Intermediate correction got prolonged by two more waves.
We could see a further increase from here as the price only came up to the first target level in which case I would expect to see further interaction with the upper resistance levels out of which the first significant one is the resistance line from the ascending triangle formed by the Intermediate correction and the upper one is the horizontal resistance once serving as support at around $4300.
If we see another increase I wouldn’t expect the price to go further than$4300 as the mentioned resistance points proved to be strong even for the impulsive move to the upside so this corrective one doesn’t have a chance unless we see a sudden increase in the momentum which I don’t believe that we will.
Zooming out on the 4-hour chart you can see the mentioned ascending triangle which was formed by the Intermediate correction and the significance behind its resistance line. I don’t believe that the price is heading further up now that it came to the most significant resistance zone and if my count is correct and this was a corrective increase we are to see the immediate downside from there.
This pattern appeared after the Intermediate W wave ended which is why I believe that we are seeing the prolongation of the correction with the current structure being the second correction out of the second wave X, which we are soon to verify as the price action further develops.

If we are to see an immediate start of the decrease that would most likely be the third Minute correction of the second wave X which will most likely be heading down to the lower support level from the ascending triangle and the intersection between its support line and the falling wedge support around $3600 serves as a zone of interest. There are some significant support point until then so we are to see what happens there but the seller’s momentum if triggered would definately be stronger then those support levels.
Market sentiment
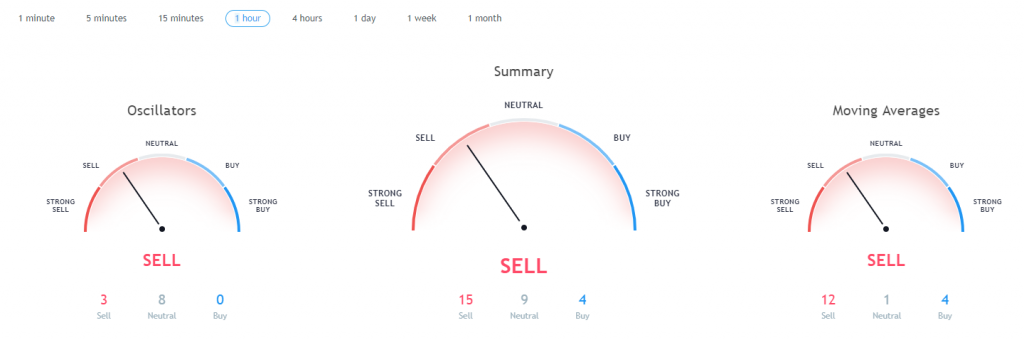
Hourly chart technical indicators are signaling a sell.
Pivot points
S3 3446.4
S2 3743.9
S1 3916.0
P 4041.4
R1 4213.5
R2 4338.9
R3 4636.4
Conclusion
The price of Bitcoin came up to its first significant resistance zone around $4150 which was expected as a corrective increase but until the price could continue increasing to its most upper resistance point at around $4300.
The interaction with those significant resistance points would most likely trigger another round of selling which would increase the momentum to the downside needed for the third corrective structure to develop.
If my count projection plays out accordingly we are to see the price of Bitcoin decrease from there to around $3600 were it’s most optimal support level is but considering other support points are in between we are yet to see how this plays out.
The post Bitcoin Price Prediction: First Target Met as Market Increases Over the Weekend appeared first on Blockonomi.

Blockonomi.com is author of this content, TheBitcoinNews.com is is not responsible for the content of external sites.
Our Social Networks: Facebook Instagram Pinterest Reddit Telegram Twitter Youtube


