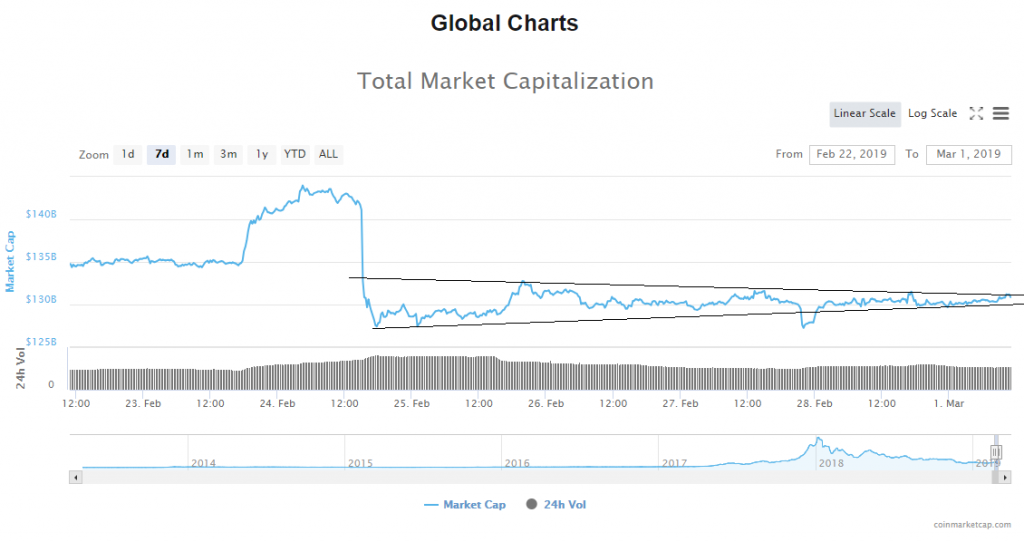
From yesterday’s open at around $127,868,505,824 the evaluation of the cryptocurrency market cap has been increasing and came to $131,211,150,765 at its highest point today.
Looking at the global chart you can see that the evaluation has created by its movement a descending trendline which in conjunction with the lower support level consist of an ascending triangle and since the evaluation interacted with its resistance line today and is getting close to the apex, we are soon going to see a breakout and a strong decisive move after period of stagnation.
It is still unclear in which direction the breakout is most likely to occur which is what we are going to be mainly examining in today’s report by looking at the chart of the major cryptocurrencies.
BTC/USD
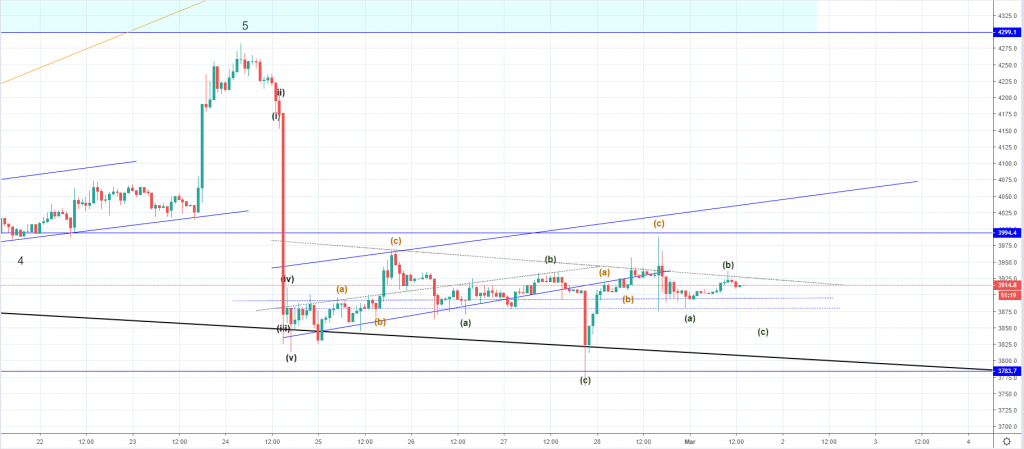
From yesterday’s open at $3870.9 the price of Bitcoin has increased at first by 3% as it came to $3986.9 at its highest point yesterday, but started immediately decreasing from there, leaving a wick on the 15-min chart and fell to $3893 at today’s open. The price is has started increasing again from today’s open but has encountered resistance from the still unconfirmed descending trendline.
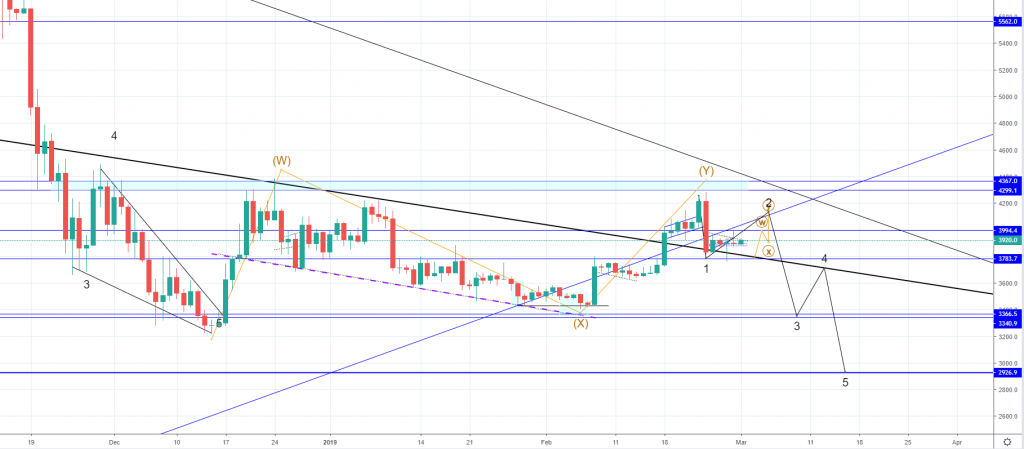
The descending trendline looks like it has rejected the price so if the price continues decreasing from here which I believe it will the trendline will be confirmed. You can see from the 15-min chart below that the price action created various trendlines and is retesting them for a primary once so this descending one will most likely serve as the most significant resistance point from the current range in which the price action has found itself after Monday’s decrease ended.
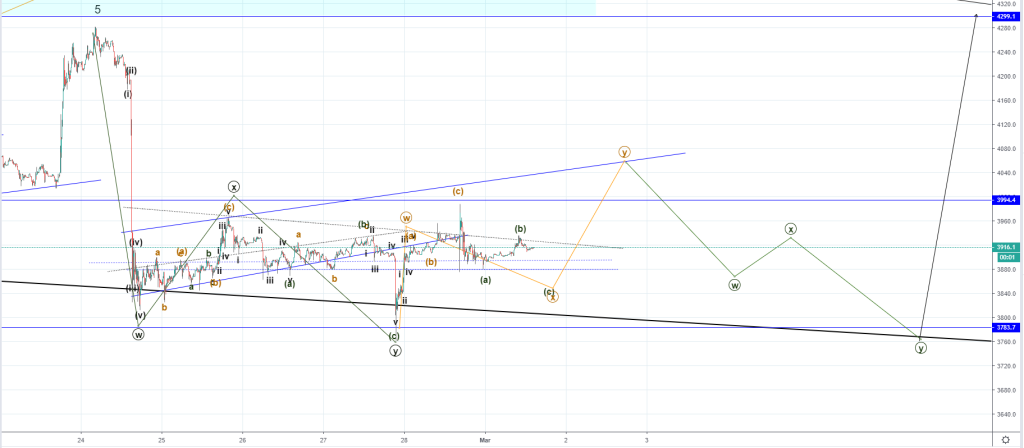
I have counted the sub-waves inside the mentioned range and as you can see I am expecting another minor drop which would be the end of the 4 consecutive ABC correction and is one to the downside. This means that another correction to the upside would play out as the price of Bitcoin might get up to the upper ascending trendline or to around the horizontal resistance level at $3994.4 for a retest of resistance before we see a breakout to the downside.
This is expected as the correction inside the range would have to constitute either 3 wave correction or a 5 wave correction and considering that we are seeing the 4th structure it could only be either the start of the next impulsive move after the correction ended or the 4th correction before the last one, according to Elliott Wave theory.
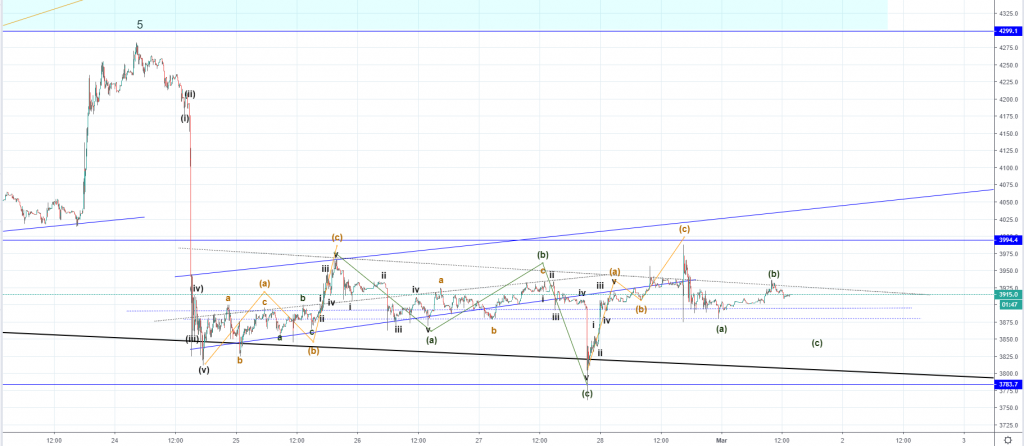
Zooming into the 5-min chart you can see that I have extensively counted the sub-waves which is why I am very confident in the accuracy of my count. The problem with the uncertainty comes from how this count should be connected which I will try to explain in further paragraphs.
On the 5- min chart you can see that the Mondays decrease has 5 waves and was moving impulsively to the downside which is why I believe it is the start of the higher degree impulse after the Intermediate WXY correction ended on the Minor 5 wave at $4258. If this is true then the current range would be the second wave out of that higher degree impulse wave and is logical why we are seeing it in a corrective manner moving sideways.
If the correction ended now on the three ABC’s it would end as a double three correction which means that what we are seeing currently is the development of the 3rd impulsive move to the downside. By looking at the wave structure of the current move I am not seeing anything impulsive which is why I don’t believe that the correction inside the range ended which is why I think we are going to see more sideways movement over the weekend as this current move would end as another ABC to the downside.
Now comes the problem of connecting the counted sub-waves into a wave of a higher degree which if counted differently changes the expected direction of a breakout. I will elaborate on the differences between them and the reasons why I’ve selected my primary as a bearish one.
Primary count
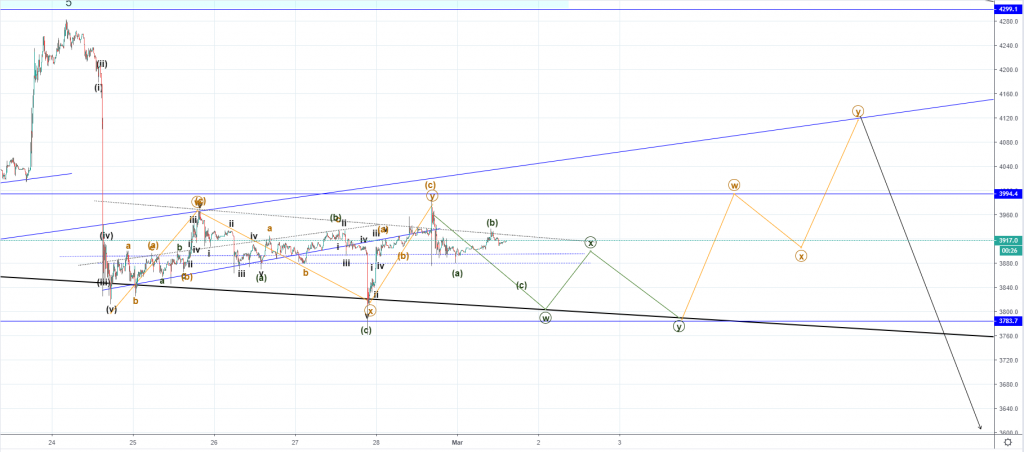
My primary count is bearish as I believe that the price of Bitcoin is undergoing a triple three correction which is the second wave of a higher degree impulse. This is because I think that the Mondays decrease was the start of the 1st impulsive move as I have counted 5 waves to the downside.
According to this projection, the price of Bitcoin could increase to around $4100 area before the trend continuation starts as the 3rd impulsive move to the downside should start.
This is in line with what I have been projecting since we have seen the first impulsive increase on the 15th of December. Looking at the daily chart below you can see that this expected impulsive move is the trend continued after an Intermediate correction ended as a 3-wave correction.
Alternative count
My alternative count is semi-bullish as it would only be the further continuation of the Intermediate WXY correction seen on the daily chart so after it ends I would be still expecting further downside for the price of Bitcoin as I don’t think that we have reached the bottom.
On the 5-min chart, you can see that in this count I have accounted for the first 5-wave decrease we’ve seen on Monday as the W wave from the first three-wave correction unlike in my primary count. The following three-wave move would, in that case, be a connector which means that another three-wave correction would develop, most likely ending on the most significant support line (bold black line) where it will find enough support for a breakout to the upside.
That would mean that the WXY correction got prolonged by two more waves out of which the currently seen correction would be the second wave X and that another wave Z to the upside is to be expected.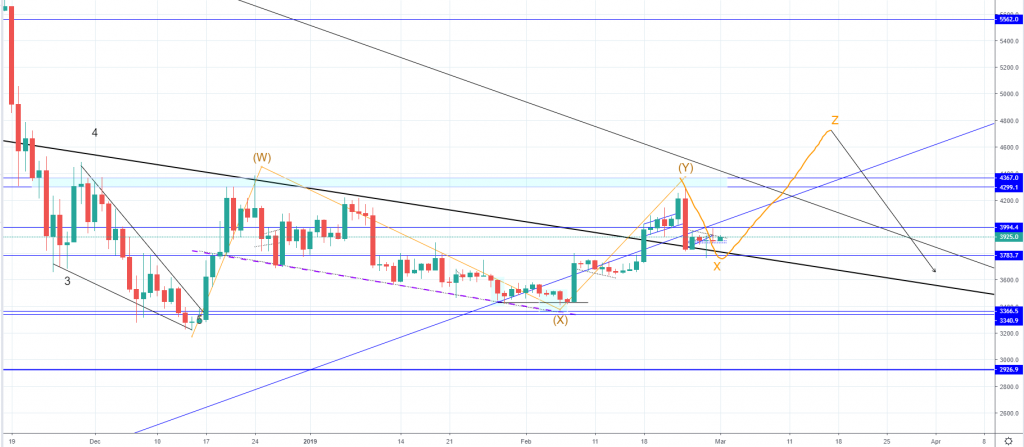
Elaboration
My primary count is bearish as I have excluded the first wave which is Monday’s decrease. I have done because corrective counts can be either in a 5-3-5 formation (Zigzag), 3-3-5 (Flat), 3-3-3-3-3 (Triangle) so if I take into account the first 5 wave move as the A from a higher degree count the count is improper as the last wave ends as a 3 wave move.
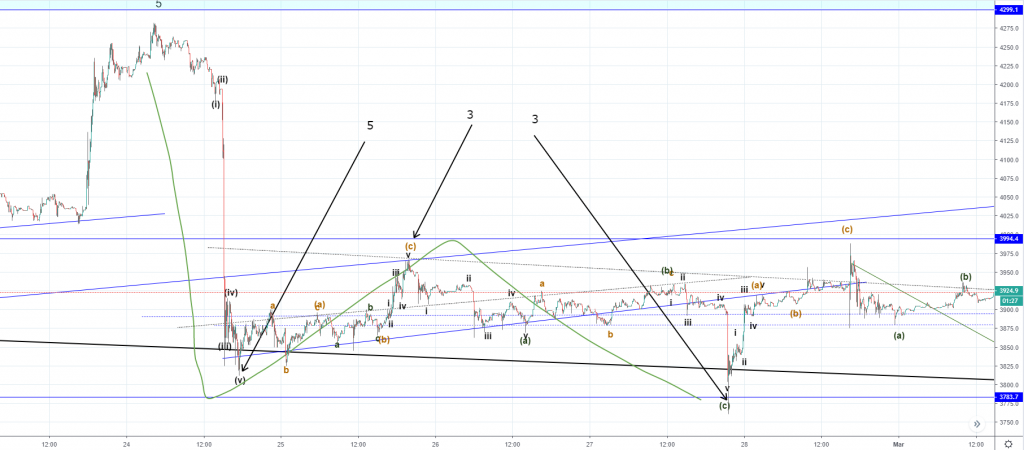
This is why my primary count excludes the first 5-wave move to the downside as being the part of the corrective count, although I haven’t discarded the possibility as I could have made a mistake when counting the sub-wave and is why I made it my alternative count.
We are soon going to receive a confirmation but until then in either way we are going to see more sideways movement.
For the latest Bitcoin News, join our Telegram!

Blockonomi.com is author of this content, TheBitcoinNews.com is is not responsible for the content of external sites.
Our Social Networks: Facebook Instagram Pinterest Reddit Telegram Twitter Youtube


