At various times during the past decade, both Bitcoin and emerging markets stocks have enjoyed substantial gains. Yet, at times, each has also endured some savage beatings from Mr. Market. So let’s examine the performance of Bitcoin vs. emerging markets stocks, examining the relative strengths and weaknesses of these two key financial markets.
This article will demonstrate the comparative relative strength (RS) of Bitcoin vs. a key emerging markets exchange-traded fund (ticker: EEM, the iShares MSCI Emerging Markets ETF) over six key time periods. You’ll view how BTCUSD fared against EEM over the past three-, six-, 12-, 24- and 36-month periods. You’ll also see how Bitcoin has dramatically outperformed EEM over the past five years. You’ll see that Bitcoin even outperformed the stocks of a major Brazilian mining company and a huge Asian semiconductor firm.
Finally, you’ll gain insights on why investing in Bitcoin and investing in emerging markets (EM) stocks might make for a good long-term investing combo.
Bitcoin vs. Emerging Markets: Key RS Data
EEM was selected as the proxy for emerging markets stocks for these reasons:
- It trades all day long (930 to 1600 ET), Monday thru Friday (except holidays).
- It’s among the most liquid of all non-US stock ETFs.
- Its holdings include a diverse array of more than 900 stocks.
- It offers an extensive array of liquid call and put options.
- Like Bitcoin, you can buy, sell, or sell it short in real-time.
- This ETF offers investors a realistic view of non-US stock market investment opportunities.
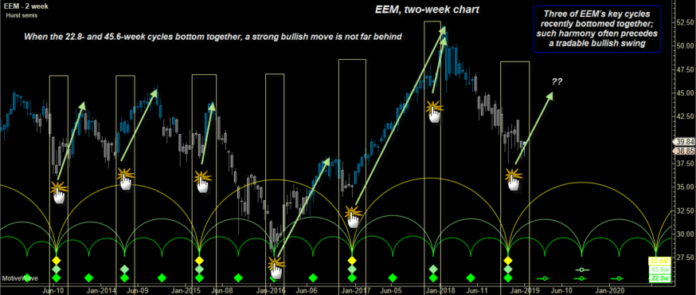
The Bitcoin (BTCUSD) vs. EEM RS stats since the December 2017’s crypto market peak currently favor EEM. Both markets have been in a downtrend since then, but EEM’s sell-off has been less severe. Notwithstanding, several bullish technicals are suggesting an imminent BTCUSD rally. As for EEM, it’s once again making a key multicycle low formation that currently boasts a seven-for-seven winning streak.
Near-Term Stats (One Year or Less)
3-month BTCUSD performance: (39.99) percent
3-month EEM performance: (3.17) percent
RS winner: EEM
6-month BTCUSD performance: -39.99 percent
6-month EEM performance: -7.31 percent
RS winner:EEM
12-month BTCUSD performance: -73.91 percent
12-month EEM performance: -18.52 percent
RS winner: EEM
Clearly, there’s been no contest in the near-term RS rankings. It’s true EEM has taken a few hits across all three near-term time frames. However, it’s value has eroded much more slowly than BTCUSD.
Long-Term Stats (Two Years or More)
24-month BTCUSD performance: +247.04 percent
24-month EEM performance: +11.18 percent
RS winner: BTCUSD
36-month BTCUSD performance: +813.58 percent
36-month EEM performance: +26.76 percent
RS winner: BTCUSD
5-year BTCUSD performance: +370.82 percent
5-year EEM performance: -0.13 percent
RS winner: BTCUSD
Key Emerging Markets Stocks: Bitcoin Also Wins
If you had invested in shares of Taiwan Semiconductor and Manufacturing (TSM) and BTCUSD on January 4, 2016, your crypto holding would be up significantly more than your TSM shares:
36-month BTCUSD performance: +784.12 percent
36-month TSM performance: +58.31 percent
RS winner: BTCUSD
Here’s a look at the 3-year performance comparison of Brazilian mining giant Vale, S.A. (VALE) vs. BTCUSD:
36-month BTCUSD performance: +784.12 percent
36-month VALE performance: +343.67 percent
RS winner: BTCUSD
No matter if it’s compared to EEM, TSM or VALE, Bitcoin’s long-term performance is impressive. Over the long haul, the Bitcoin vs. emerging markets question definitely finds its answer in Mr. Nakamoto’s decentralized, digital brainchild.
EEM: Potential Advantages and Disadvantages
EEM holds a wide variety of stocks from developing nations such as Argentina, Brazil, China, India, Indonesia, Malaysia, Mexico, Philippines, Russia, and Thailand among others. It also takes positions in stocks hailing from more advanced countries like South Korea and Taiwan, plus a few more. Individual EM shares can offer investor and speculator alike the potential for outsized gains. However, these volatile stocks can also decline in value at a rapid pace, causing serious portfolio drawdowns. Given these realities, trading a basket of diversified EM stocks via EEM may result in a somewhat smoother portfolio equity curve.
Adding EEM to your investment portfolio may offer you the following advantages:
- International investment exposure for US investors
- Worldwide stock sector and industry group representation
- Minimization of company-specific risk (poor earnings reports, company scandals, regulatory or trade issues)
- Above-average growth potential, depending on the economic cycles of the nations represented by the stocks contained within EEM
Now, just because there are identifiable advantages to holding some EEM shares in your portfolio, don’t ignore the potential risks:
- Country-specific currency collapses or hyperinflation (Argentina is a recent example)
- Political instability (military coups, a president assuming dictatorial powers, etc.)
- International trade wars can also cause havoc with the bottom lines and stock prices of EM-based companies.
EEMs Current Technical Backdrop
The technical chart you’re about to view is among the more unique that you’re ever likely to encounter. EEM boasts one of the most reliable price cycle rhythms among major ETFs. It’s extremely rare to see seven consecutive multicycle lows forming right on time, in any financial market. Yet, EEM has managed to accomplish this astounding feat once again:
EEM, two-week chart: This key emerging markets ETF just made another multicycle low. Will this bottoming process lead to another buying opportunity? Image: MotiveWave Ultimate.
Chance might appear to favor a tradable rally in the days ahead, but only time will tell. Remember, just because a chart pattern repeats over and over (and with a successful investment result), the outcome of any trading or investment opportunity is a purely random outcome, not connected to any series of winners or losers that preceded it. This is why you never bet the ranch on any one trade setup or market, no matter how bullish or bearish the opportunity may present itself as.
Bitcoin’s Latest Chart Pattern
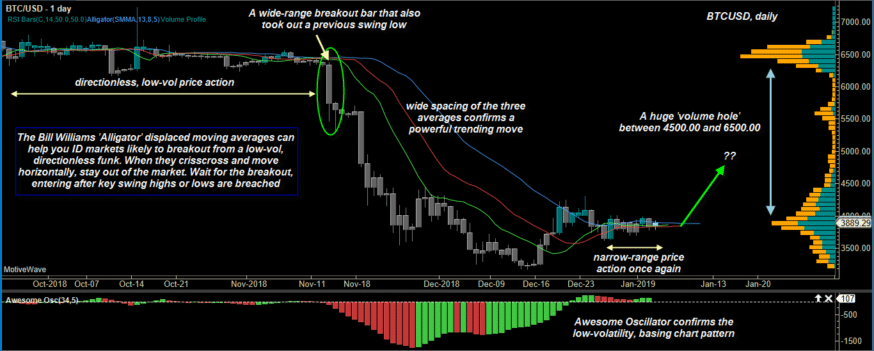
Bitcoin has seemingly stabilized after its late 2018 plunge (down nearly 50% in five weeks). It too features a nominally bullish cyclical pattern, and a tradable rally back up into the $5,000 area looks like a realistic possibility in Q1 2019:

BTCUSD, weekly: Bitcoin is once again trading in a narrow range. Its cycles suggest a rally is coming soon, and there is little overhead supply to stop it before hitting $6,500. Image: MotiveWave Ultimate.
Bitcoin’s current sideways price action is frequently seen before a bullish breakout moves. Since the coin was anticipated to bottom sometime in January 2019 and a huge ‘volume hole’ is looming just above the $4,000 level, it won’t take much for some big traders to get a nice rally going here. Without going into a complete tutorial here, the Bill Williams Alligator (the three displaced moving averages on the chart) indicator does an outstanding job of helping you confirm both trading range and trending markets. If your trading platform offers the Alligator, then, by all means, spend some time learning how to use it. You will likely find it to be a go-to technical tool from now on.
All Together Now
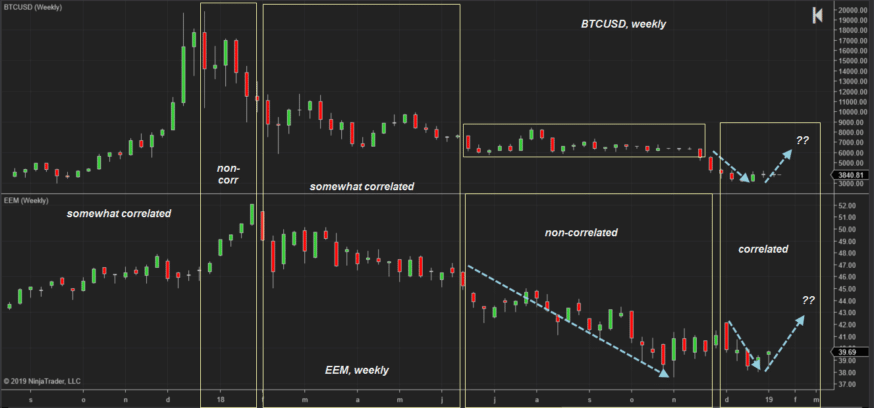
Viewing BTCUSD and EEM together, it’s obvious that this particular market pair isn’t overly correlated. When one rallies, the other may stagnate or even go the other way. Sometimes, one market trades in a narrow range, even as the other trends strongly. Assuming similar long-term non-correlation, BTCUSD and EEM could prove to be excellent diversifiers for your portfolio:

BTCUSD and EEM, weekly: Bitcoin and emerging markets stocks are generally non-correlated, making them attractive components within a diversified investment portfolio. Image: NinjaTrader 8
At the moment, both Bitcoin and EEM look poised for rallies, but their respective timing and durations are, of course, unknowable. An obvious tipoff of an emerging rally is the appearance of wide-range breakout price bars and above-average trading volumes. If you plan to buy either market, be sure to keep your per-trade risk small, at 2 percent of your account value or less.
Balancing Act
Perhaps you’re committed to holding Bitcoin for the long-haul. Maybe you’d even like to hold on to your Bitcoin position until last year’s all-time high is exceeded by a factor of three or even five times (or more). That’s surely an admirable goal, but make sure that you don’t put all of your hope (or money) on that one, bullish-only outcome.
Consider balancing out your cryptocurrency investment portfolio with a variety of other non- or inversely correlated financial instruments such as gold, tech stocks, real estate, and emerging markets stocks. You may not get the thrill of seeing your Bitcoin-only portfolio rally by 300 percent (well, someday). However, neither will you suffer the horror and dismay of another 85 percent Bitcoin drawdown, even as other asset classes appreciate in value or experience only minor declines. Playing good defense is what wins the big games in the sports world. The same is also true in the game of intelligent investing and financial market speculation.
All data via TradingView.com. The final data cutoff date was January 4, 2019, for BTCUSD, EEM, TSM, and VALE. Commissions, slippage and stock dividends not factored in.
The post Bitcoin vs. Emerging Markets Stocks | Which Asset Is Better for You? appeared first on CoinCentral.

Coincentral.com is author of this content, TheBitcoinNews.com is is not responsible for the content of external sites.
Our Social Networks: Facebook Instagram Pinterest Reddit Telegram Twitter Youtube


