


Ethereum price (ETH) has halted its upward trend, highlighting that confirmation bias is a dangerous thing. Let’s take a look at the current situation and where ETH/USD may be headed next.
Ethereum Price Stirs Bears
While the general market set up was bullish up till this morning, the echo chamber of bullish news and moon sighting technical analysts coming from all angles seems to be generating a bit of confirmation bias within the crypto community. Hopefully today’s Ethereum price pullback will serve as a reminder that just because everyone says it is so doesn’t make it so.
On the BUIDL side of things, partnerships, new developments, protocol upgrades, and mainstream adoption just keeps chugging along strong and this is great for the everyone, technologists, and speculators included. Investors seem to be playing whack a mole with the hottest altcoins and Ontology, LOOM, Enjin, BAT are all evidence of this.
BTC price stability around $4,000 is providing lucrative opportunities for those trading BTC/Altcoin pairings and Binance’s IOST competition with a 16,000 BNB purse is sure to perk traders interest in the same way it did for ONT’s, which managed to gain approximately 30% during Binance’s recent trading competition.
4-Hour Chart
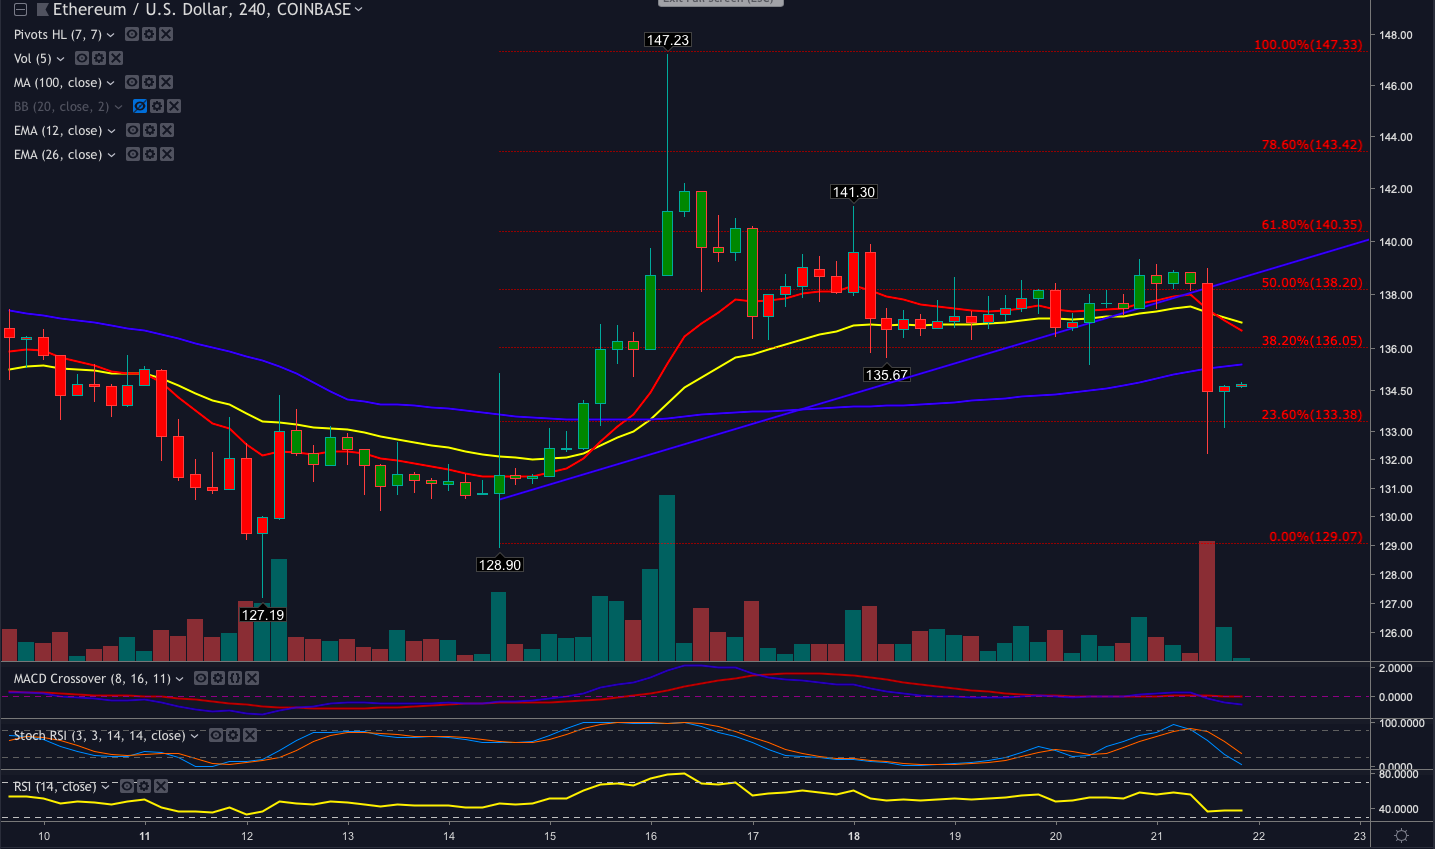
ETH price 00 has been locked in a tightening range with resistance at $138, $140 and $142, and today’s hiccup pulled ETH below a strong support at $135.
This pinned in price action corresponds with BTC’s repeated rejection at $4k and $4,050 and today’s pullback could mean bears have woken up from their brief nap and re-established their positions at BTCs recent top. Price action over the coming days with provide greater insight into this.
ETH found support at $132 and now consolidates near $134. With the exception of a high volume break out from Bitcoin, ETH will likely return to the $135 to $138 range and remain pinned in by overhead resistance.
Daily Chart
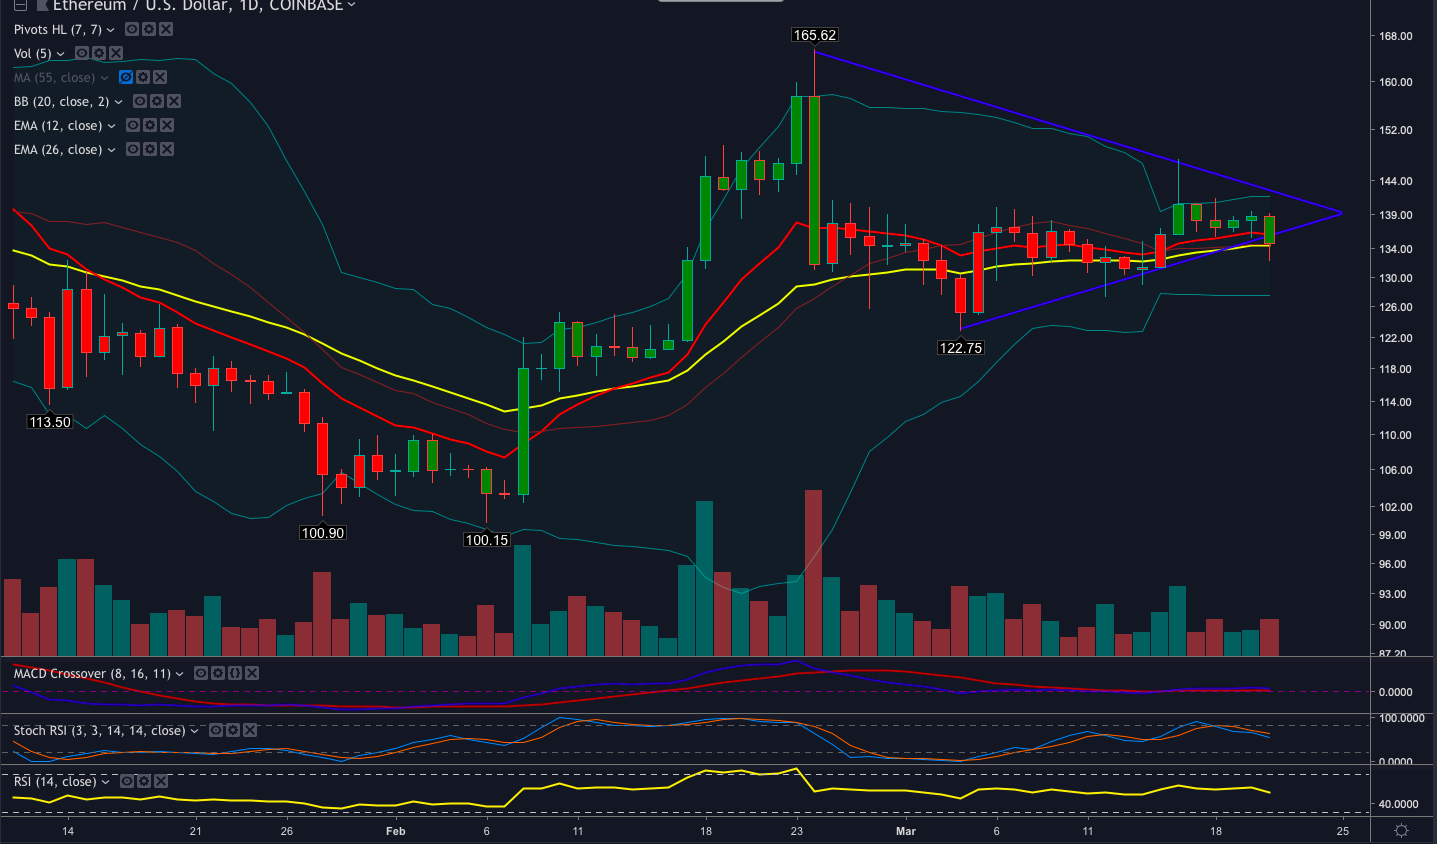
The daily chart shows that Ethereum price broke below the ascending trendline but the altcoin is slowly crawling back into the upper arm of the Bollinger band indicator and the exponential moving averages have not turned bearish.
The weekly time frame raises some cautions signals and ETH is on the verge of losing its uptrend and closely currently rides atop the 26ema.
On the 4-hr chart, the RSI flatlined in oversold territory and the Stoch and MACD remain bearish Conservative traders could wait for a bullish cross over and enter on strength above $140, $142, while swing traders might have an opportunity to purchase at or below the recent swing low if ETH’s situation fails to improve.
ETH traders should also keep an eye on the 12 and 26 EMA on the ETH/BTC pairing as it has provided a bit more insight than the ETH/USD pairing.
Trade Bitcoin (BTC), Litecoin (LTC) and other cryptocurrencies on online Bitcoin forex broker platform evolve.markets.
[Disclaimer: The views expressed in this article are not intended as investment advice. Market data is provided by Bitfinex and Coinbase.]
Images courtesy of Shutterstock, TradingView. Market data sourced from Bitfinex and Coinbase
The post Ethereum Price Analysis: ETH Loses the Daily Uptrend appeared first on Bitcoinist.com.

Bitcoinist.com is author of this content, TheBitcoinNews.com is is not responsible for the content of external sites.
Our Social Networks: Facebook Instagram Pinterest Reddit Telegram Twitter Youtube


