


Ethereum continues to outperform in relation to Ripple’s XRP widening the gap between the two in terms of market cap.
This is the third week that Ethereum is recording an increase and the price increase this week is being recorded on even the larger volume than the previous two weeks.
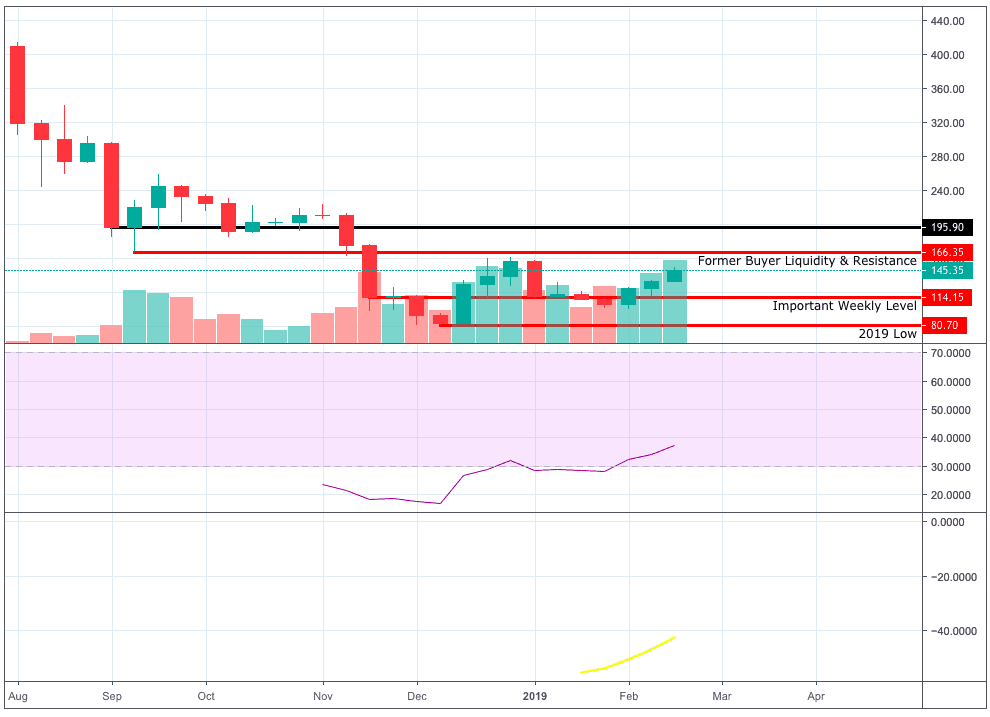
 Ethereum Daily Chart
The majority of the increase was accounted for on Monday with an appreciation of over 10% taking place.
Ethereum has since been testing resistance at $147 but has yet failed to close above this level.
Price has already tested this level multiple times increasing the likelihood that it can break above.
Multiple tests of a level make the level weaker with progressively fewer sellers to hold the level on each test.
 Ethereum 4-Hour Chart
Despite multiple tests, buying pressure on the shorter-term 4-hour timeframe is dropping off with both the MACD and the RSI decreasing.
There is a triple top forming but with more bullish signs on the longer-term timeframes, the pattern may have little impact.
If the triple top pattern were to play out, it would indicate that we will see a drop to support at $139 and a sharp drop below.
 XRP Weekly Chart
XRP has spent several weeks trading at support and has failed to gain significant buyer momentum to increase from this point.
Price has managed to form a high this week greater than the highs of the previous five weeks, but it has retraced much of this increase.
If price were to break below this support level, an important level on the monthly timeframe is below at $0.2475.
This level would be expected to provide significant support
 XRP Daily Chart
The price increases early in the week brought XRP above expected resistance at $0.313.
Price now trades between this level as support and $0.336 above.
 XRP 4-Hour Chart
Recent price action makes it far more likely that price will break below $0.313 than above $0.336.
Price has been forming lower lows and lower highs and testing the $0.313 level.
The MACD and RSI are also decreasing on the 4-hour showing that momentum is with the sellers.
Key Takeaways:
- Ethereum continues to outperform XRP after a surge on Monday.
- Ethereum has spent the majority of the week testing resistance at $147 whereas XRP is currently testing support at $0.313.
- Triple top forming in the Ethereum 4-hour chart indicates downside movements but will likely have little impact with the longer-term timeframes forming more bullish patterns.
RELATED ARTICLES
MORE FROM OUR PARTNERS
Advertisement
blokt.com is author of this content, TheBitcoinNews.com is is not responsible for the content of external sites.
Our Social Networks: Facebook Instagram Pinterest Reddit Telegram Twitter Youtube


