Band Protocol is one of August’s best-performing crypto assets, right behind the showstopping Chainlink and other hot tokens. The altcoin is up over 300% month to date, but a 15% correction began overnight. Is this just a healthy pullback, or will the asset retrace further than most investors are prepared for? Here are five bearish signals that the Band crash may only be beginning.
DeFi And Decentralized Oracles Spark Mini-Crypto Bubble, 300% Returns Month-to-Date
The cryptocurrency market is on fire, with nearly every asset posting major gains over the last few weeks. But no segment has been hotter than decentralized finance and the data-providing decentralized oracle space.
Chainlink has been setting new record high after high, and its closest competitor, Band Protocol, has been following in its fiery footsteps.
Both crypto assets have been on a parabolic rally so powerful, that when it does finally run out of steam, the crash could end up being violent.
RELATED READING | WHY TOPPLING SILVER AND GOLD PRICES COULD BE ESPECIALLY BAD FOR BITCOIN
For now, however, BANDUSD has only corrected a meager 30% in the face of over 300% returns in the last month. The asset is also up over 9000% since the March Black Thursday low.
Just like Bitcoin’s rise to $20,000 corrected down to $3,200 at the low, Band and Chainlink will be bound to similar laws of gravity. But given the momentum in decentralized oracles, it is difficult to call the top.
However, there are five bearish signals visible in just one four-hour price chart that could be a sign that this recent correction will go a lot deeper.
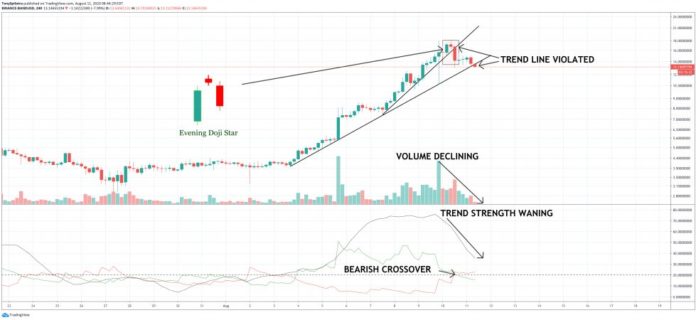
BANDUSD Five Bearish Signals + Average Directional Index 4H Price Chart | Source: TradingView
BANDUSD has corrected nearly 30% over the past 24 hours. Now it is up to bulls to regain the upper hand and drive prices higher or risk a more serious crash now that the uptrend support line has been violated.
Losing two important uptrend lines is just one of five bearish signs on the four-hour BANDUSD price chart. The top of the rally before the trend line broke down forming an evening star pattern – a bearish reversal signal.
Trading volume is also declining, suggesting that the recent uptrend has concluded, and investors are quickly losing interest. Backing up that theory is the Average Directional Index showing that the strength of the uptrend is waning.
RELATED READING | ANALYSTS WARN OF TURBULENT “DOG DAYS” OF SUMMER; WILL BITCOIN’S RALLY SURVIVE?
After reaching the highest reading ever on the ADX, it has since been turning downward. Coinciding with the drop in trend strength, a bearish crossover on the Directional Movement Index lines suggests that bears have taken control.
How far the correction may go is anyone’s guess, but after such a parabolic rise, an 80% correction is possible after such an advance is broken. The same sort of drop happened to Bitcoin and the rest of the crypto space after the bubble. The DeFi and oracle mini-bubble pay be bursting right now, leading to a deeper crash than investors are prepared for.
Featured image from Unsplash.

Bitcoinist.com is author of this content, TheBitcoinNews.com is is not responsible for the content of external sites.
Our Social Networks: Facebook Instagram Pinterest Reddit Telegram Twitter Youtube


