


As per the current condition, both IOTA and EOS are following a slightly bearish trend at the moment. IOTA is currently holding the 9th position and veering around the $1 mark whereas EOS is still struggling to reach the $8.00 figure due to its recent dip and holds the 5th position. Below you would find the comprehensive price analyses of these two (Data provided as of 10th July 2018).
IOTA (IOTA/USD)
Price Analysis:
- High: 1.046 USD
- Low: 1.0007 USD
- Major Resistance Level: 1.5 USD
- Hourly MACD: Placed in the sell zone.
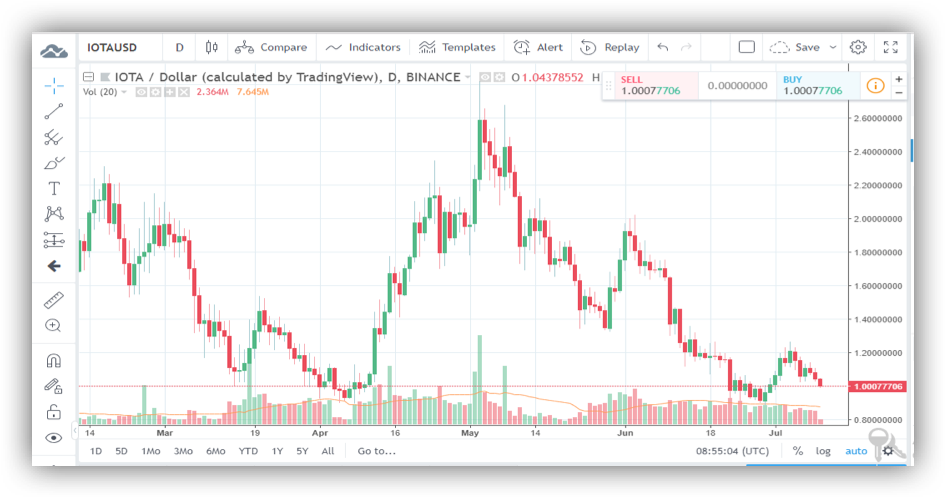
This cryptocurrency is currently revolving around the 1 US dollar mark and following a slightly bearish trend. However, if we examine the chart closely and implement the Fibonacci extension tool on its pullback, we would be able to see that it is almost ready to bounce off the top of its descending channel thereby resuming its sell-off position. The short-term SMA is still below the long-term SMA indicating that the path of least resistance is still downwards.
The full extension is located at 0.0930. However, with a stronger selling pressure, the IOTA extension could be down by 50% reaching the 0.6864. The gap between the moving averages is slowly decreasing which is manifestly a positive sign as it indicates the fact that the current bearish trend is weakening and about to reverse. The RSI (Relative Strength Index) is also showing a propensity to go upward which is another indicator of the bullish trend.
EOS (EOS/USD)
Price Analysis:
- High: 7.7800 USD
- Low: 7.3250 USD
- Major Resistance Level: 9.03 USD
- Hourly MACD: Placed in the sell zone.
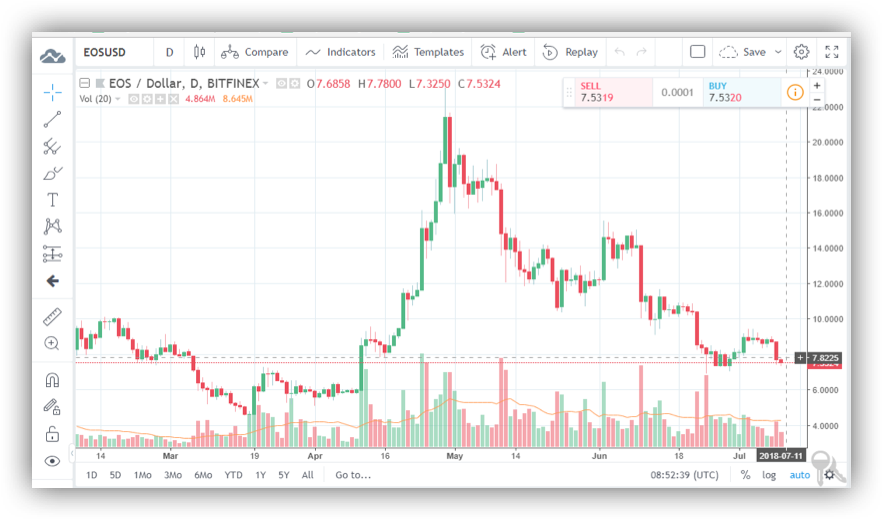
Like Ripple, the very existence of EOS coin depends on its stability. According to a recent analysis, this coin has grown nearly 32 times since its inception and the main reason behind it is the stability of EOS blockchain network. However, for the past few days, the general trend of this coin has been overwhelmingly bearish. The price of this coin has been revolving around the $7.5 mark over the past week with $9 being the obvious resistance. As per their previous trade plan, the EOS team is planning on liquidating on every pullback with $4 targets.
Similar to the IOTA chart, the gap between the moving averages is also gradually decreasing in case of EOS as well indicating an imminent bull run. Also, the relative strength index is showing an upward trend. Hence, despite the recent dip in price by approximately 11%, the beginning of a bullish trend should be a matter of time for EOS.
Happy Trading!!
For the latest cryptocurrency news, join our Telegram!
Disclaimer: This article should not be taken as, and is not intended to provide, investment advice. Global Coin Report and/or its affiliates, employees, writers, and subcontractors are cryptocurrency investors and from time to time may or may not have holdings in some of the coins or tokens they cover. Please conduct your own thorough research before investing in any cryptocurrency and read our full disclaimer.
Image courtesy of Pexels
Charts courtesy of tradingview.com
The post IOTA and EOS Price Analysis: The Current Scenario appeared first on Global Coin Report.

Globalcoinreport.com/ is author of this content, TheBitcoinNews.com is is not responsible for the content of external sites.
Our Social Networks: Facebook Instagram Pinterest Reddit Telegram Twitter Youtube


