


As the reader is no doubt aware, technical analysis is the process of understanding the market simply through analyzing the behavior of its participants. It often provides a stark and valuable check and balance measure when a pure technical analyst forges an opinion to be balanced against those of fundamental analysts working to understand the same market.
This perspective is very poignant when applied to the cryptocurrency complex at present, particularly in the cases of Tron (TRX) and IOTA, as we shall see.
IOTA
Price Analysis
- High: $1.03327
- Low: $1.01279
- Major Resistance Level: $1.065
- Hourly MACD: Lateral Consolidation
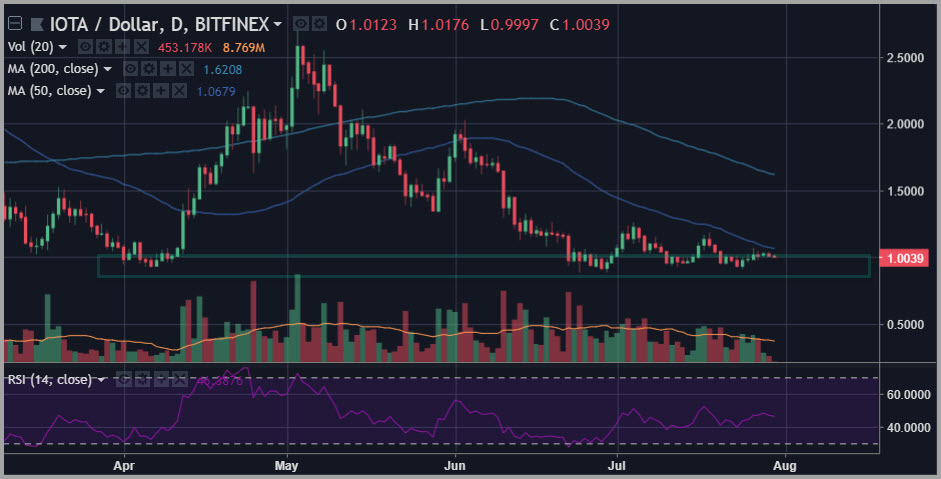
IOTA, while trailing some other major coins in the crypto complex over the past month, continues to represent a coin that remains well above the levels that we were seeing last fall.
In fact, IOTA is still 200% above where it was last November. This is significant as we have seen so many coins give up everything they saw during the maniacal bull run witnessed in the cryptocurrency complex in November and December of last year.
Without question, the critical factor right now for IOTA is to hold on to the $0.88 support level “for dear life”.
A hold at this point in the process could very well unleash a break back up to retest recent range highs between the $1.18 and $1.25 levels. If this type of move can be managed at this point, one could make a very strong case that IOTA has successfully formed its double bottom support measured against the April lows, thus clearing the way for potentially much higher prices ahead.
Tron (TRX)
Price Analysis
- High: $0.038697
- Low: $0.036306
- Major Resistance Level: $0.04
- Hourly MACD: Pullback in Emerging Bullish Pattern
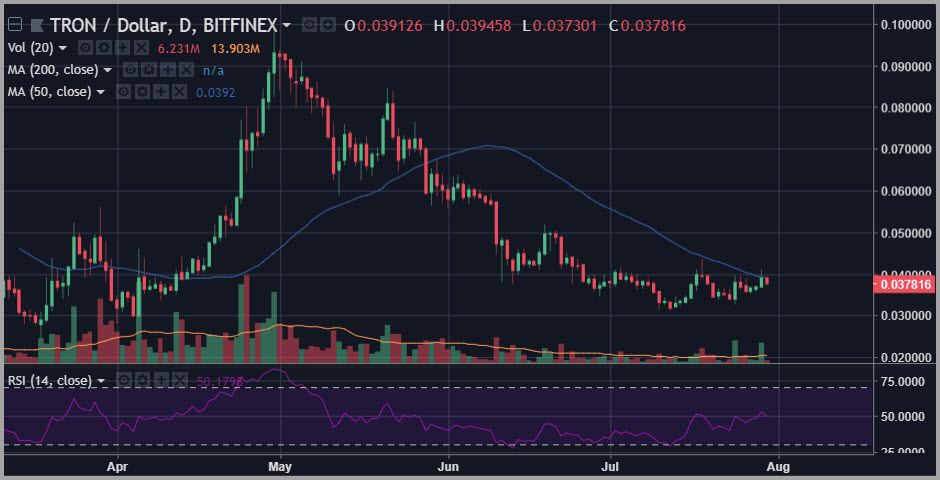
Tron (TRX) has been gradually curling off of its mid-July lows in a manner that is highly suggestive of a potentially important bottom.
This pattern has particularly evolved over the last 48 hours to include what may well be a breakout above the 50-day simple moving average now in progress.
This could be particularly important because it also represents a possible break above important resistance at the $0.04 level. This has been an important level for Tron (TRX) going back over the past eight months and possibly longer.
In addition, we have recently seen another technical measure evolve on the TRX chart that supports this same idea: a 14-day RSI bullish divergence that blossomed on July 23.
If we continue to see the current process play out, it could potentially make way for a breakout move in a test of the 200-day simple moving average at the next important level of $0.05.
Happy Trading~
For the latest cryptocurrency news, join our Telegram!
Disclaimer: This article should not be taken as, and is not intended to provide, investment advice. Global Coin Report and/or its affiliates, employees, writers, and subcontractors are cryptocurrency investors and from time to time may or may not have holdings in some of the coins or tokens they cover. Please conduct your own thorough research before investing in any cryptocurrency and read our full disclaimer.
Image courtesy of Pexels
Charts courtesy of tradingview.com
The post IOTA Tron (TRX) Price Analysis – New Technical Doors May be Opening appeared first on Global Coin Report.
Read more at https://globalcoinreport.com/iota-tron-trx-price-analysis-new-technical-doors-may-be-opening/

Globalcoinreport.com/ is author of this content, TheBitcoinNews.com is is not responsible for the content of external sites.
Our Social Networks: Facebook Instagram Pinterest Reddit Telegram Twitter Youtube


