


Litecoin has recently broken out of a descending channel on the Bitcoin pair and looks poised for a bullish reversal as Bitcoin continues to create lower lows. Traders speculate Bitcoins decline could fuel a Litecoin pump over the coming days.
Litecoin 1-Hour Price Analysis
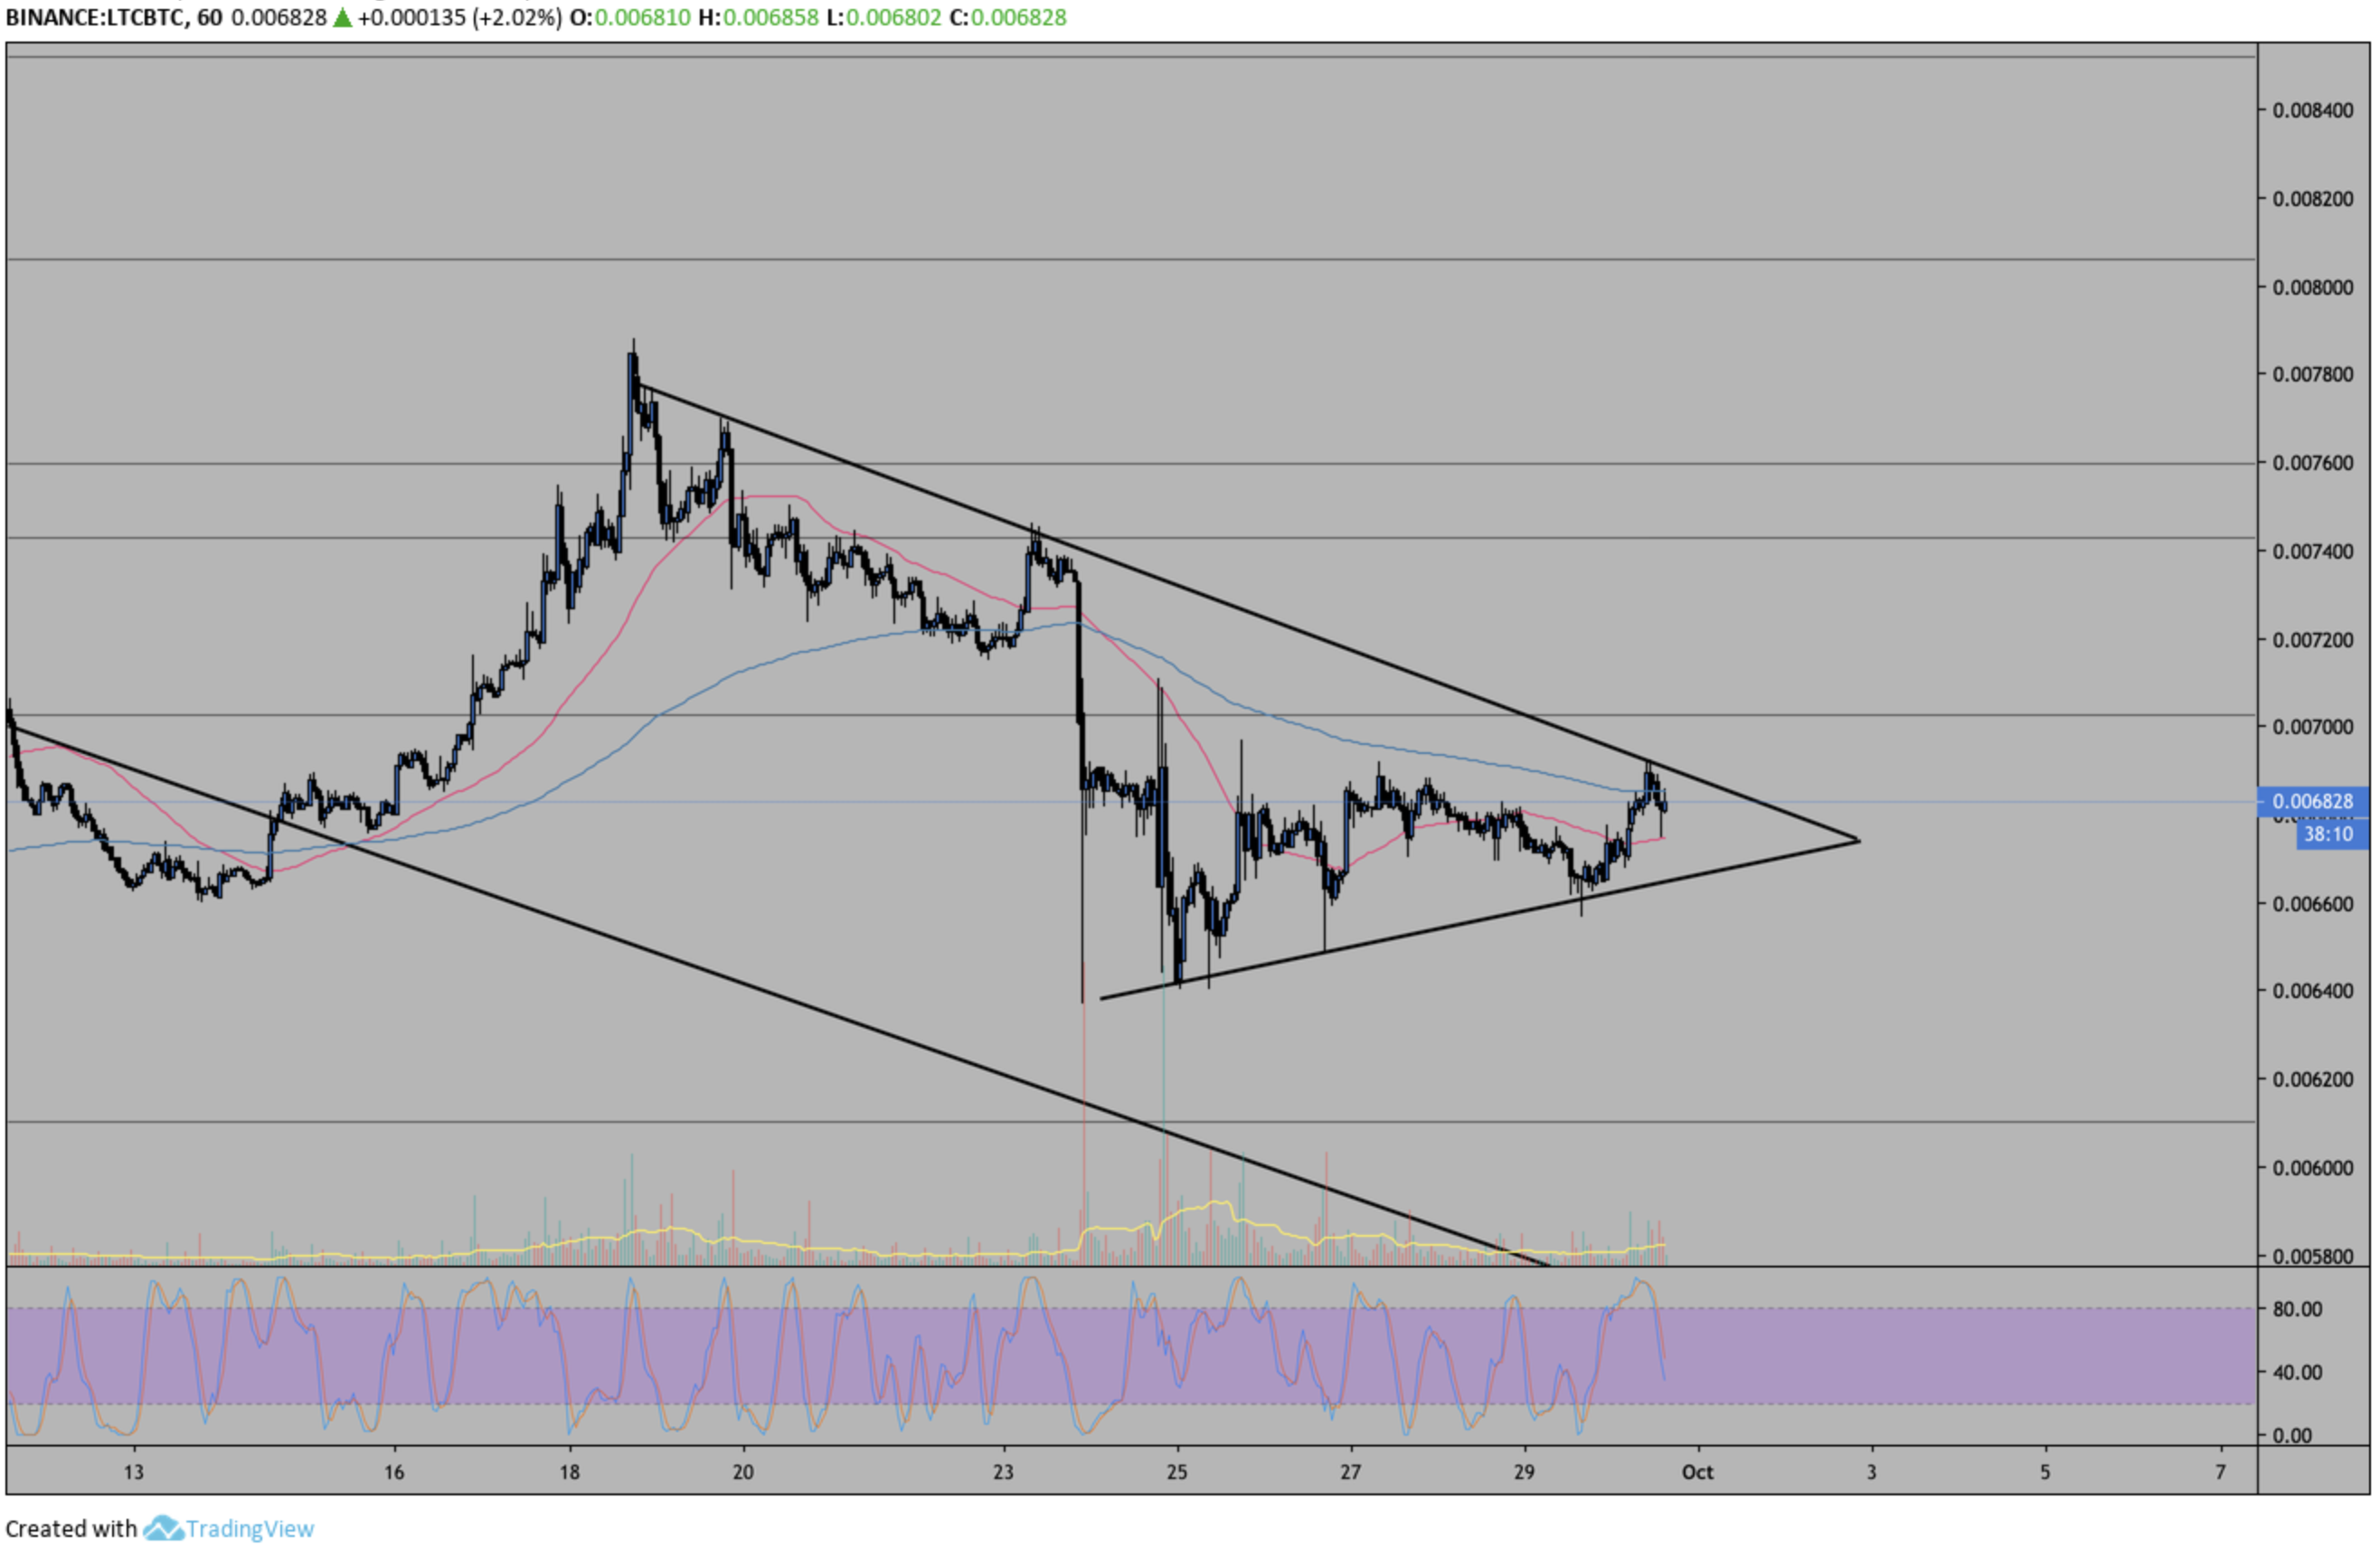
On the 1 hour chart for LTC/BTC we can see a wedge type pattern has formed as price levels re-test close to the breakout point of the descending channel which will be visible on the daily analysis below. Typically, price action will re-test any breakout point before Litecoin price levels begin to pump. The wedge has created a clear descending overhead resistance, which if broken will likely result in a dramatic increase.
The breakout point for the smaller wedge on the hourly chart sits just 1-2% above the current market price. A short-term decision will be made within the next 2-3 days, and will be determined by whichever direction price action breaks through the current wedge. If the overhead resistance at 0.006900 sats is broken to the upside, a higher high for the visible range is expected to be made taking price levels to above 0.008000 sats. Adversely, if price levels break-down through the wedge support, a drop to 0.0061000 sats is likely.
Both the 50 EMA and 200 EMA are moving close to each other and will likely cross over in conjunction with a breakout. If price levels breach either way out of the wedge I will be looking for a crossover of these EMA’s to take place along with increasing or decreasing volume to confirm the sustainability of the breakout or breakdown.
Daily Price Analysis
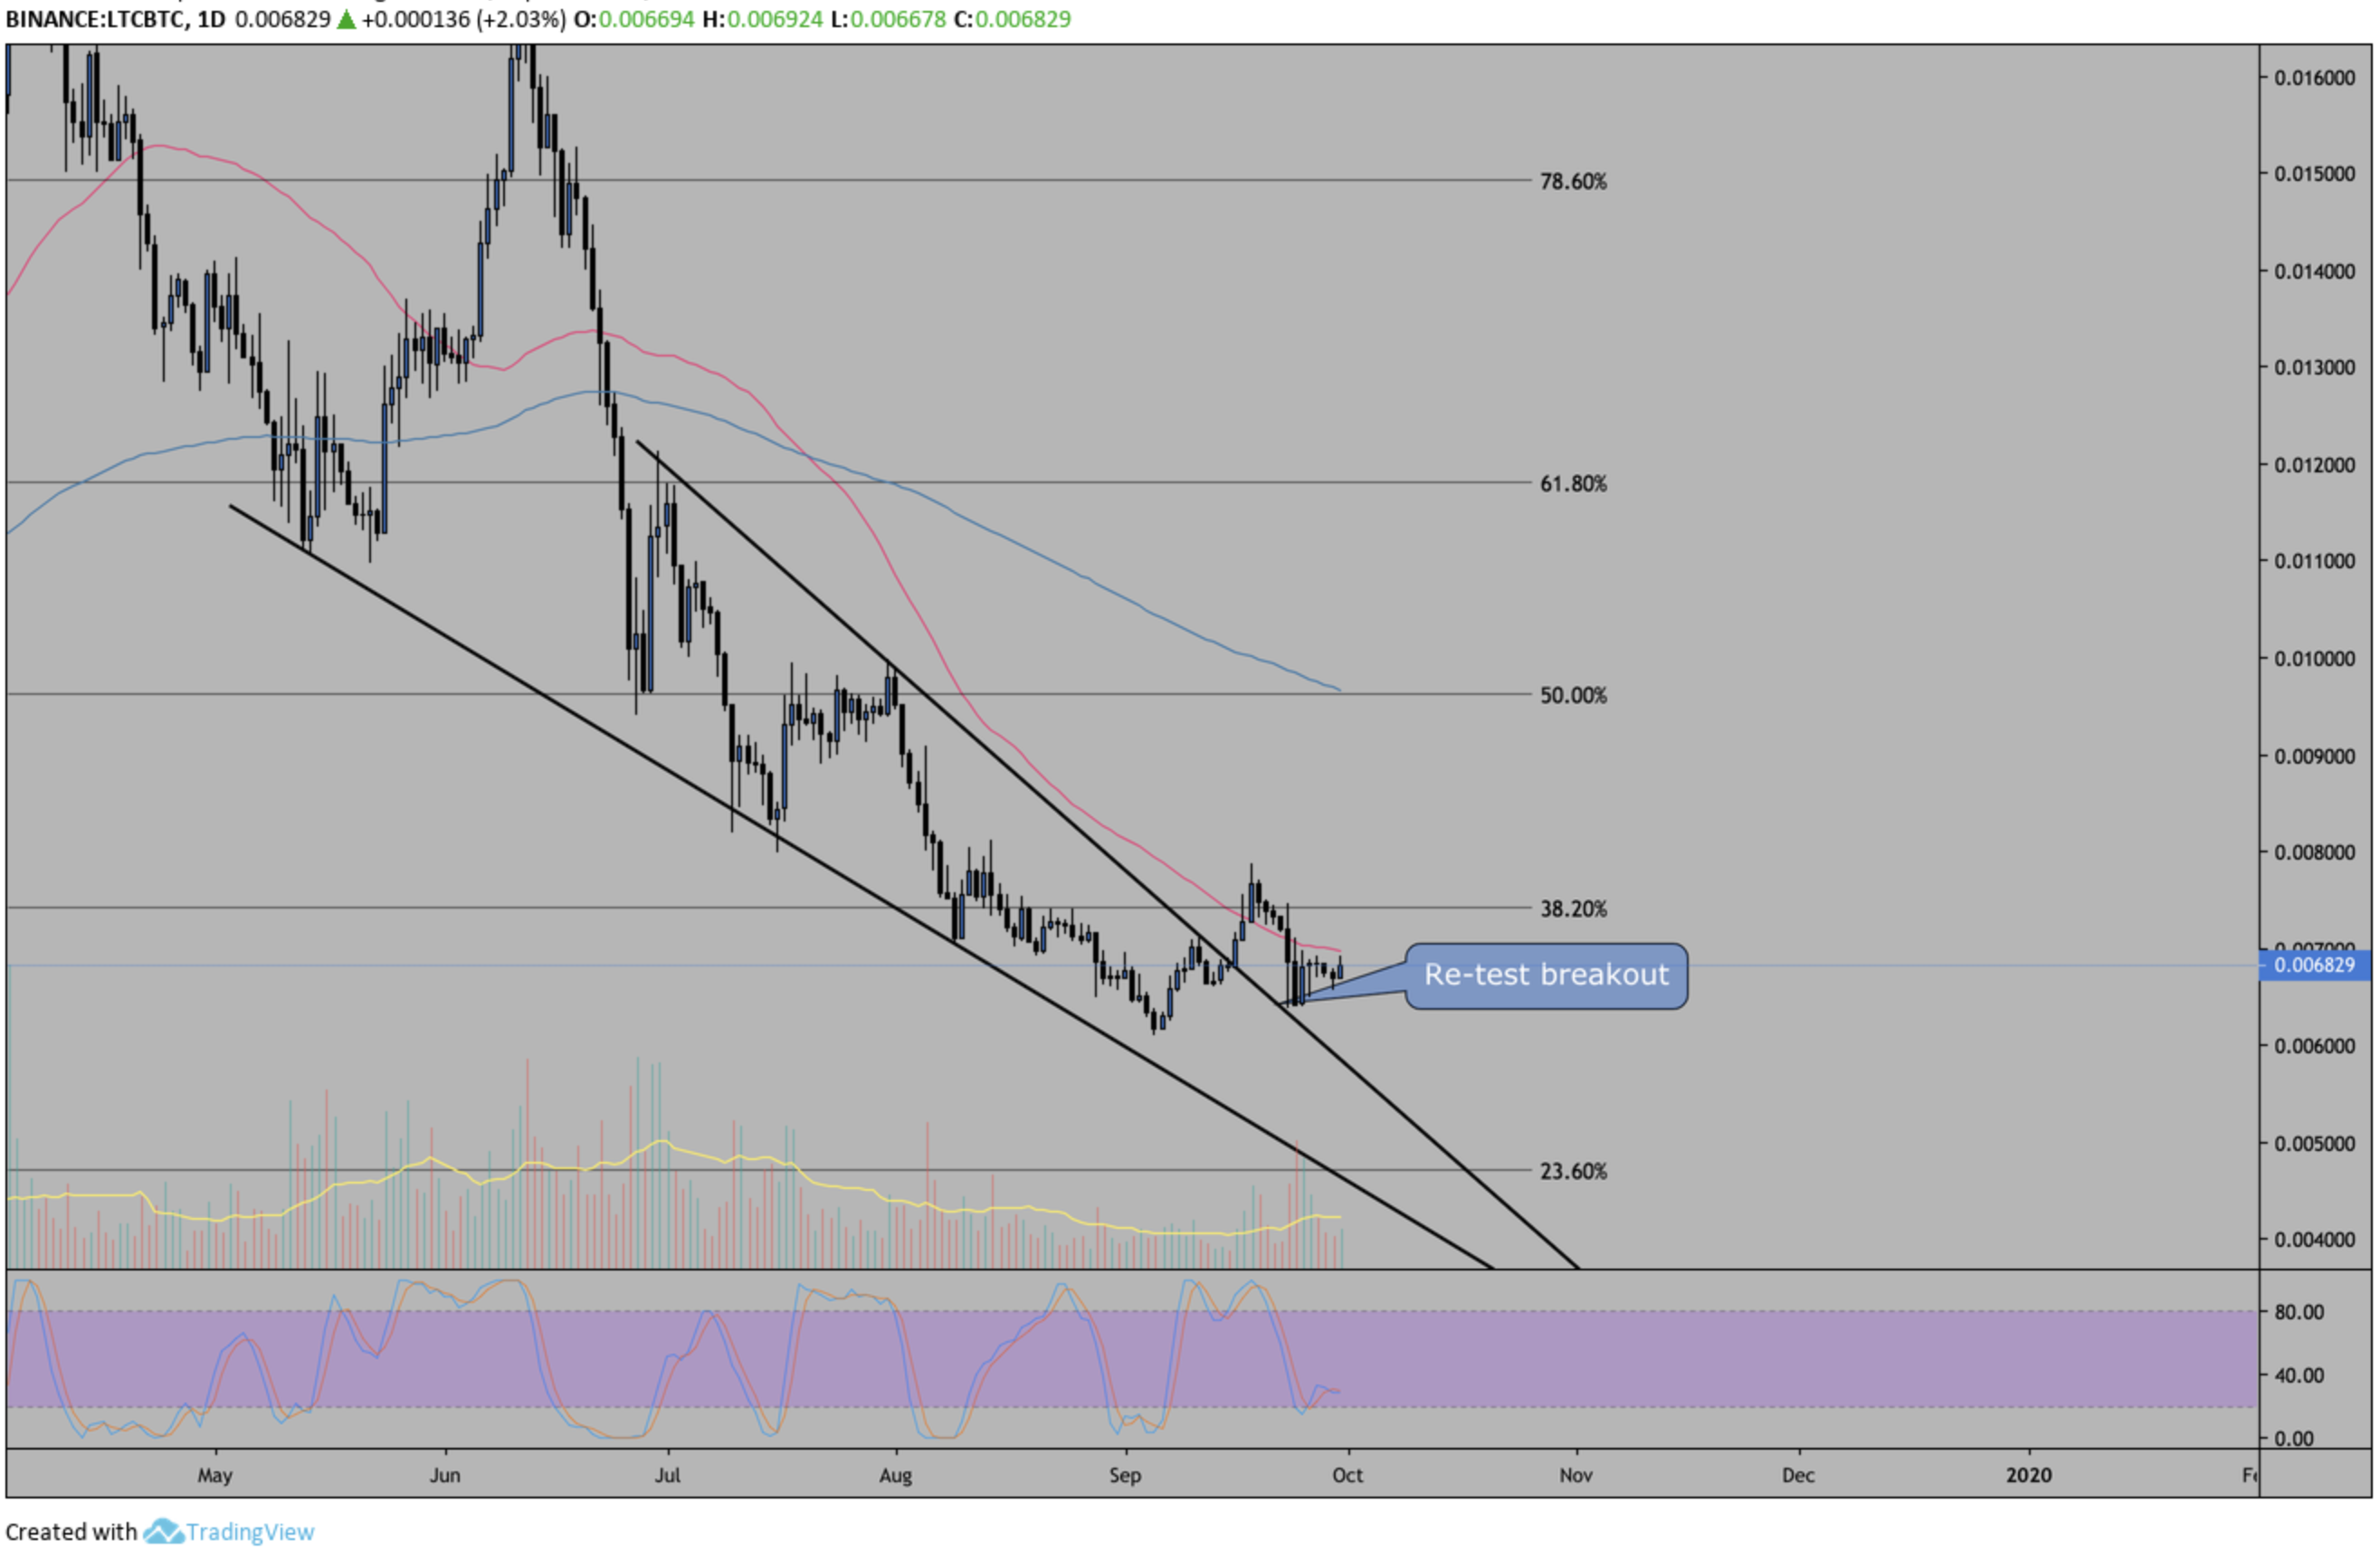
On the 1 day chart for LTC/BTC, we can see the descending channel that has formed stemming back to price action in May through to July. Price levels have seen a steep decline over the last few months as Litecoin sheds around 50% of its value. The re-test of the breakout point as mentioned in the hourly analysis above is now more visible.
RSI hovers just above oversold as the 50 EMA sits just 1-2% above the current market price. The 50 EMA can be used as a resistance point that needs to be passed in order to sustain bullish momentum. The 200 EMA at 0.009600 sats can be used an ambitious profit target providing there is a bullish breakout.
Do you think Litecoin will attempt a bullish reversal over the coming days as a result of the recent breakout? Please leave your thoughts in the comments below!
This article is strictly for educational purposes and isn’t to be construed as financial advice
Images via Shutterstock, LTCBTC chart by Tradingview
The post Litecoin Price Analysis: LTC Poised For Bullish Reversal appeared first on Bitcoinist.com.

Bitcoinist.com is author of this content, TheBitcoinNews.com is is not responsible for the content of external sites.
Our Social Networks: Facebook Instagram Pinterest Reddit Telegram Twitter Youtube


