Digital currency markets have started to show strong signs of recovery after dropping to new lows last week. On Monday, a number of cryptocurrencies gained between 2-5% over the course of the day. Crypto prices have held steady into the next day and many digital assets will likely test key resistance levels in order to press forward.
Also Read: Money and Democracy: Why You Never Get to Vote on the Most Important Part of Society
Crypto Markets See Percentage Gains But Strong Resistance Lies Ahead
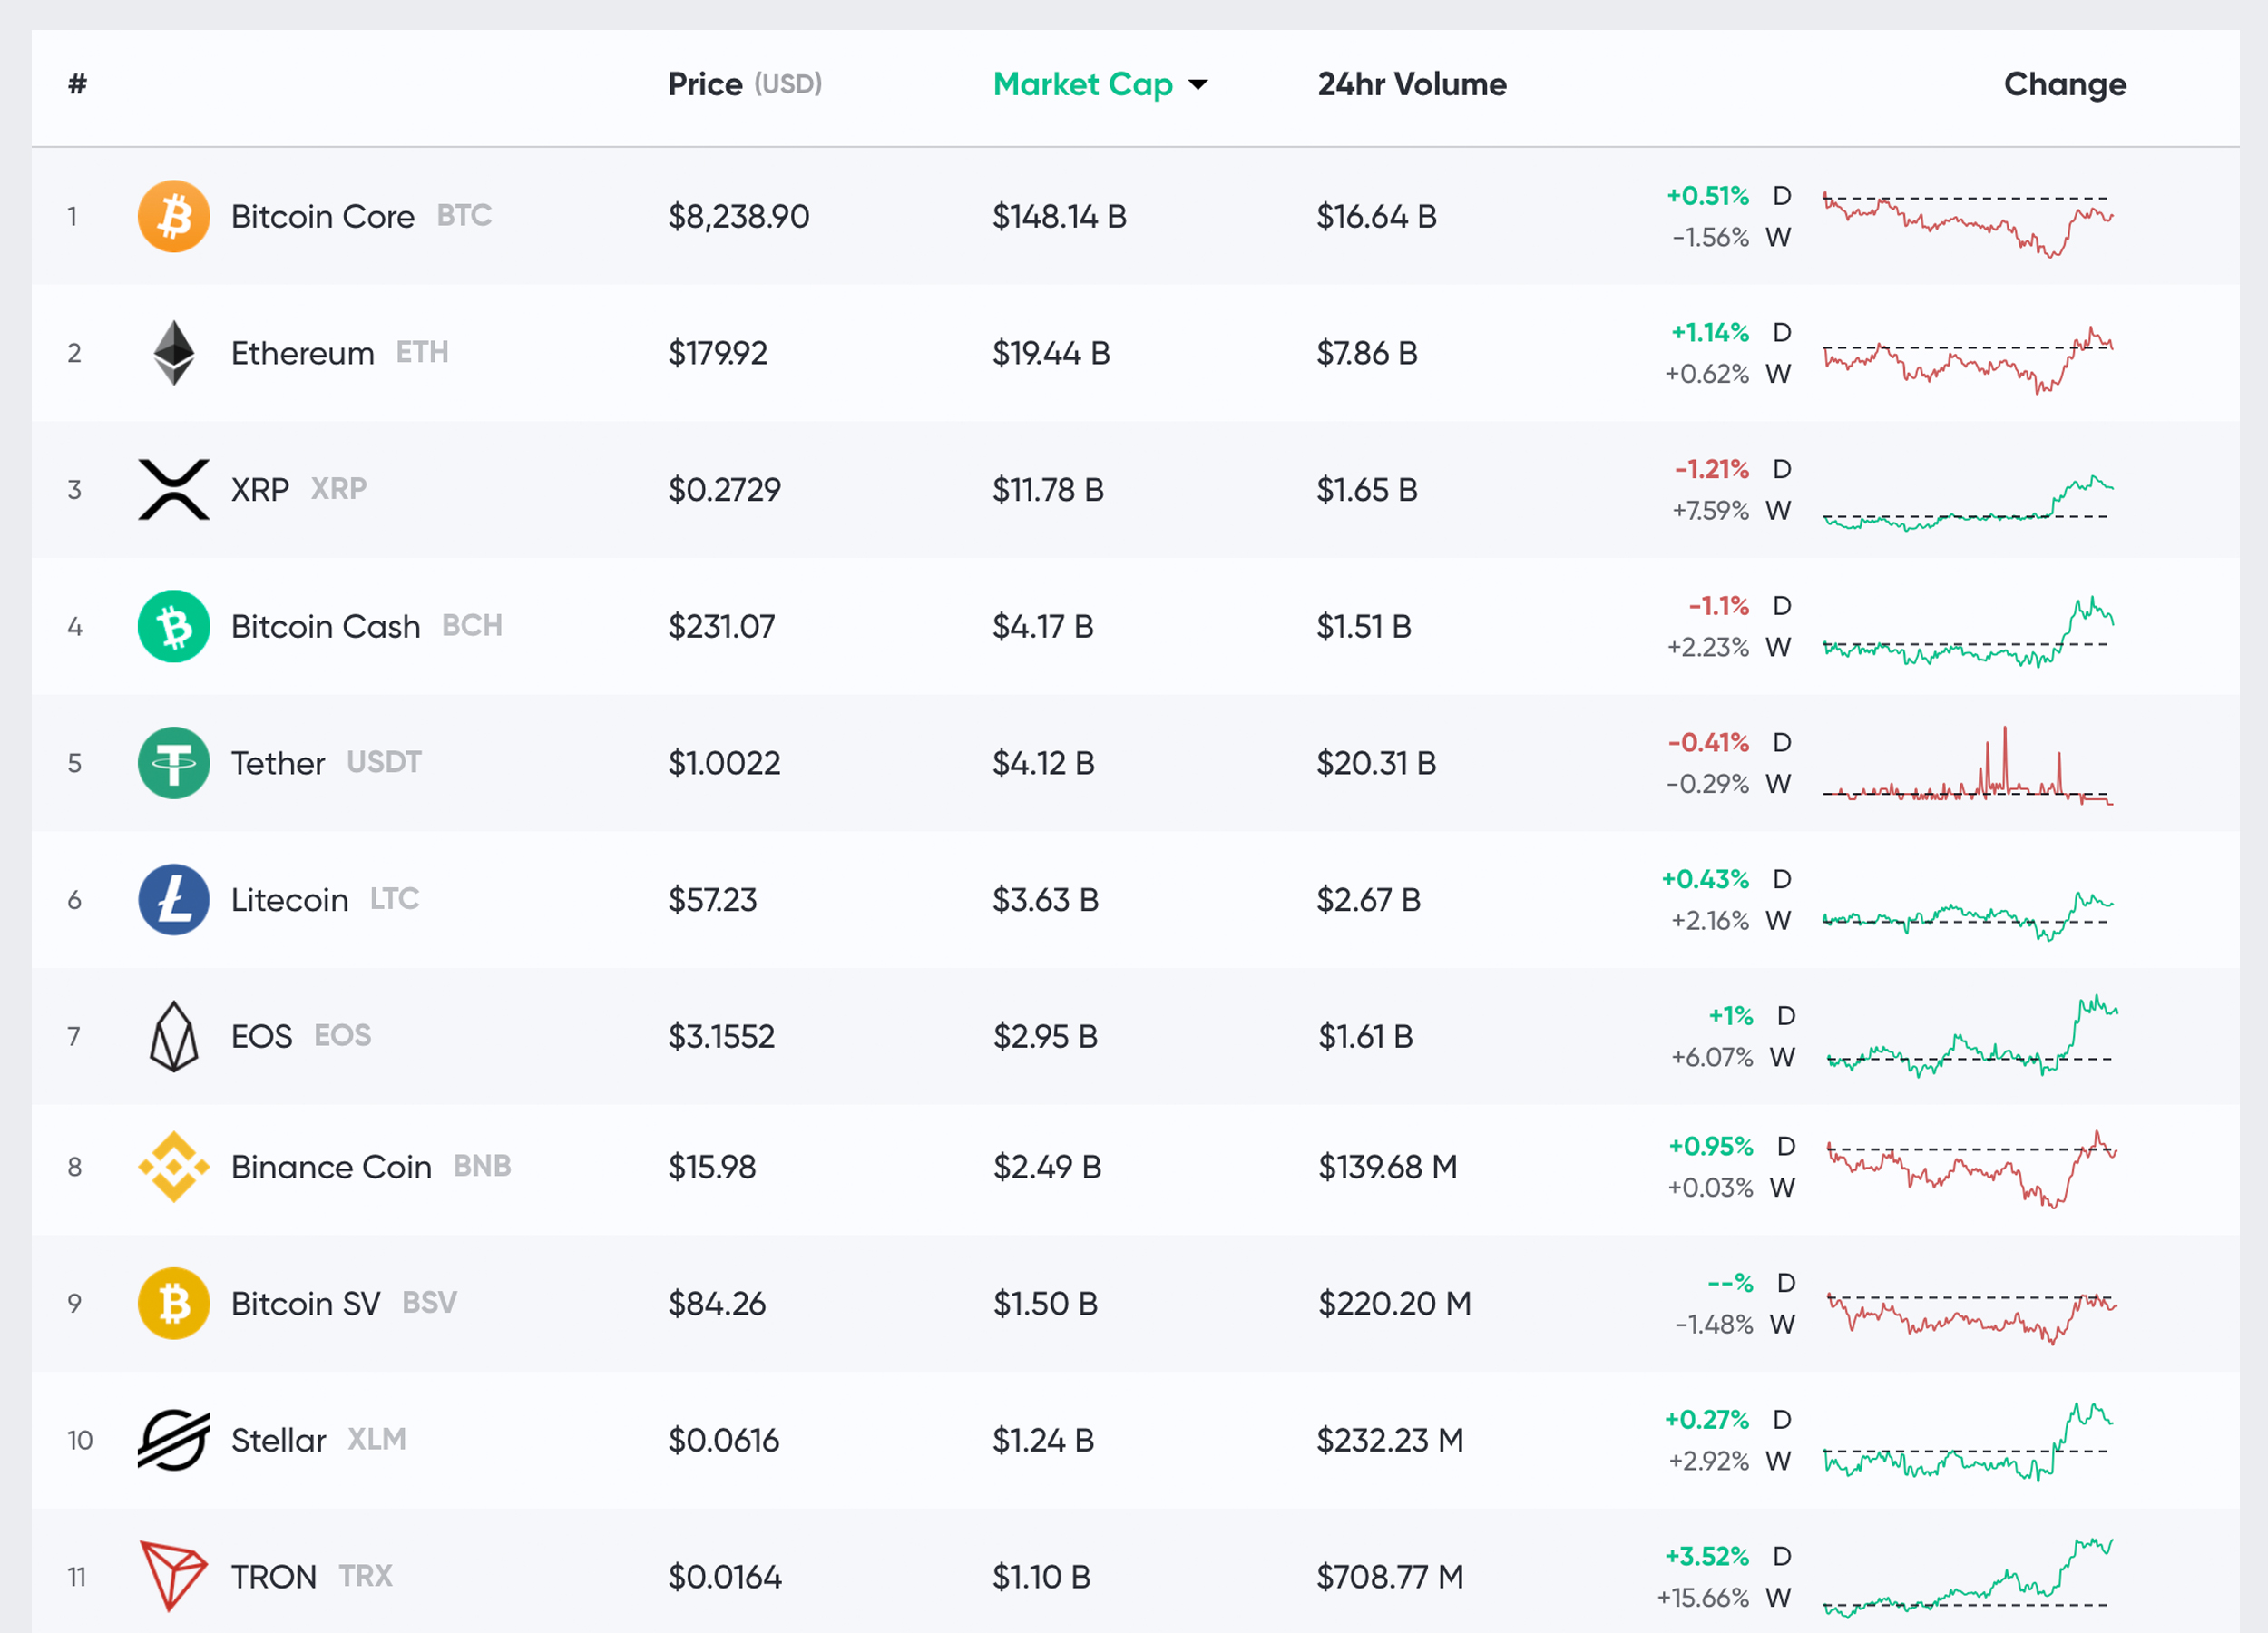
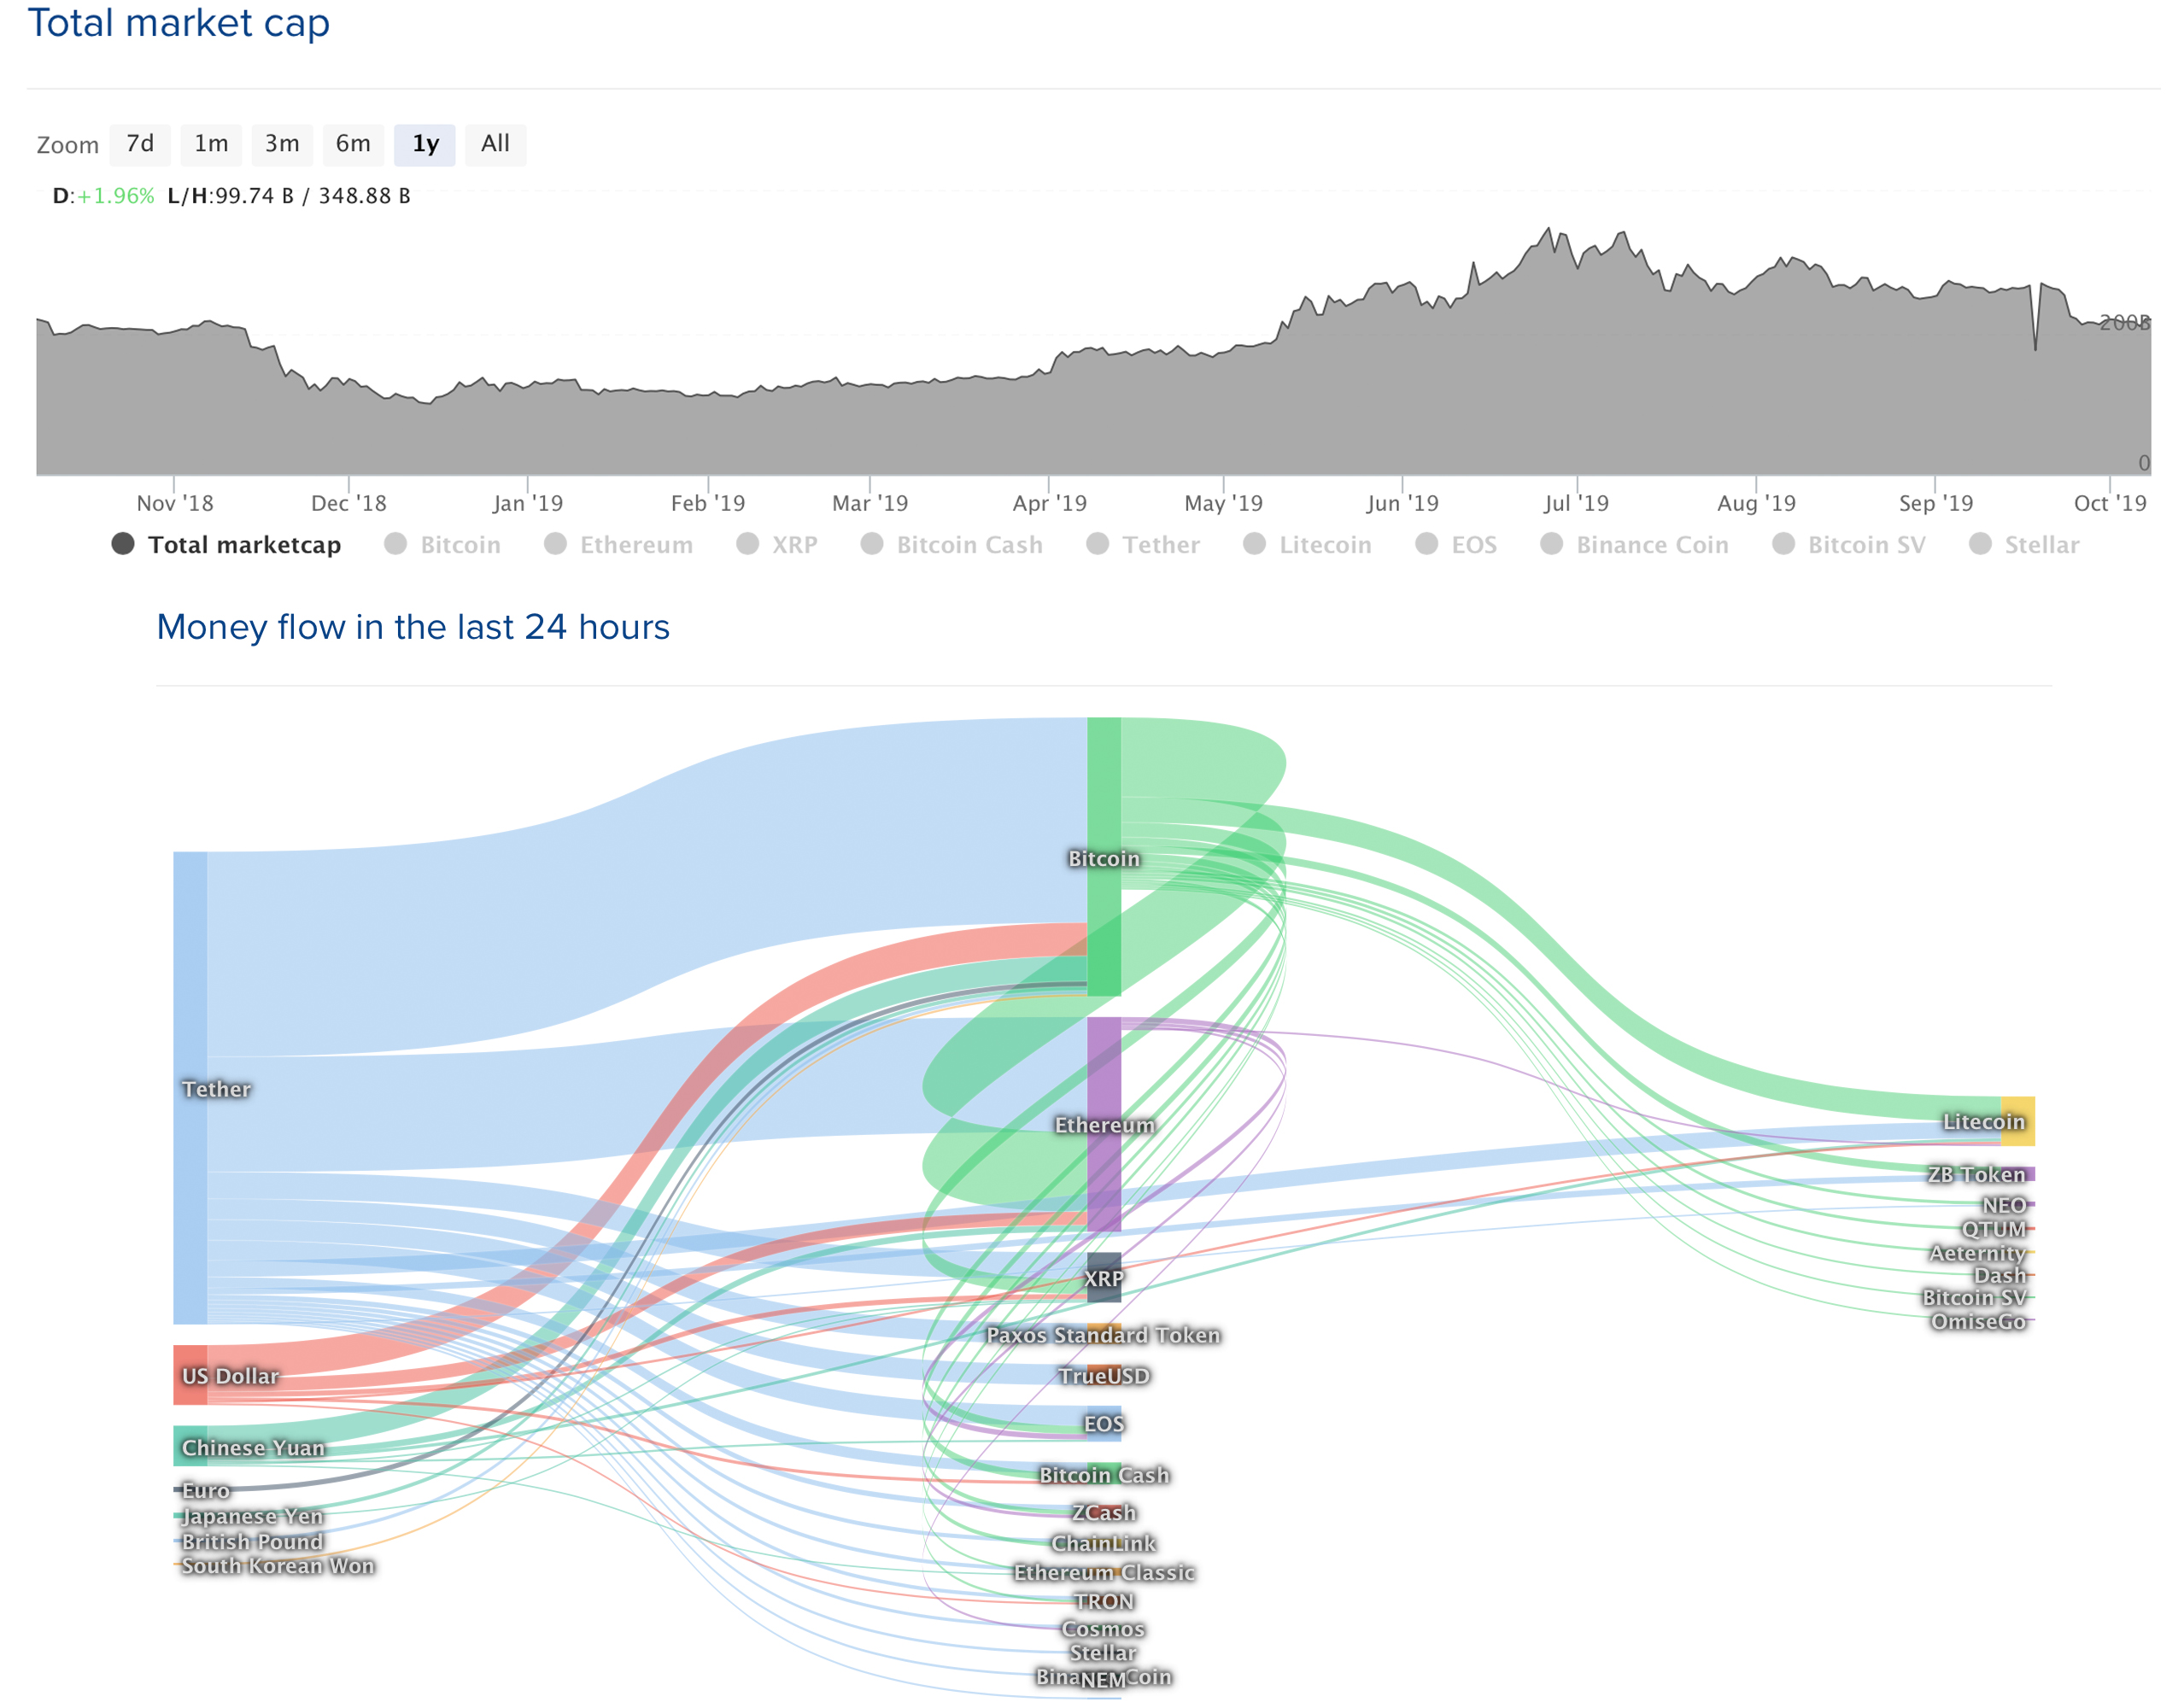
Last week the cryptoconomy was in a slump and prices dropped sharply on Friday, October 4, and slid even lower two days later on Sunday. On October 6, the price of BTC fell below the $8K region to a low of $7,800 per coin. The following day saw some recovery as crypto bulls started to regain control. Since the big drop on Sunday, roughly $22 billion has been added to the combined market capitalization of all 2,000+ digital assets. On Tuesday, October 8, BTC is trading for $8,238 per coin and is up 0.51%. BTC has an overall market cap of around $148 billion and $16.6 billion in trade volume. These metrics have attributed to BTC dominance (the coin’s market capitalization in relation to the entire cryptoconomy’s valuation) dropping to a low of 66%.

Ethereum (ETH) markets are up 1% and each ETH is swapping for $179. For the last seven days, ETH has gained 0.62% and is currently seeing $7.8 billion in global trade volume. Ripple (XRP) is down today (1.2%) after it gained 10% on Sunday but XRP is still up by 7% for the week. Bitcoin Cash (BCH) has managed to knock tether (USDT) out of fourth position on Tuesday. Tether, however, still dominates by global trade volume capturing $4 billion more in trade volume than BTC. Despite the negative headlines in the press, the amount of USDT in circulation has increased to 4,108,044,456 at the time of writing. The stablecoin is paired with dozens of coins and commands around two thirds of every crypto trade on October 8.

Bitcoin Cash (BCH) Market Action
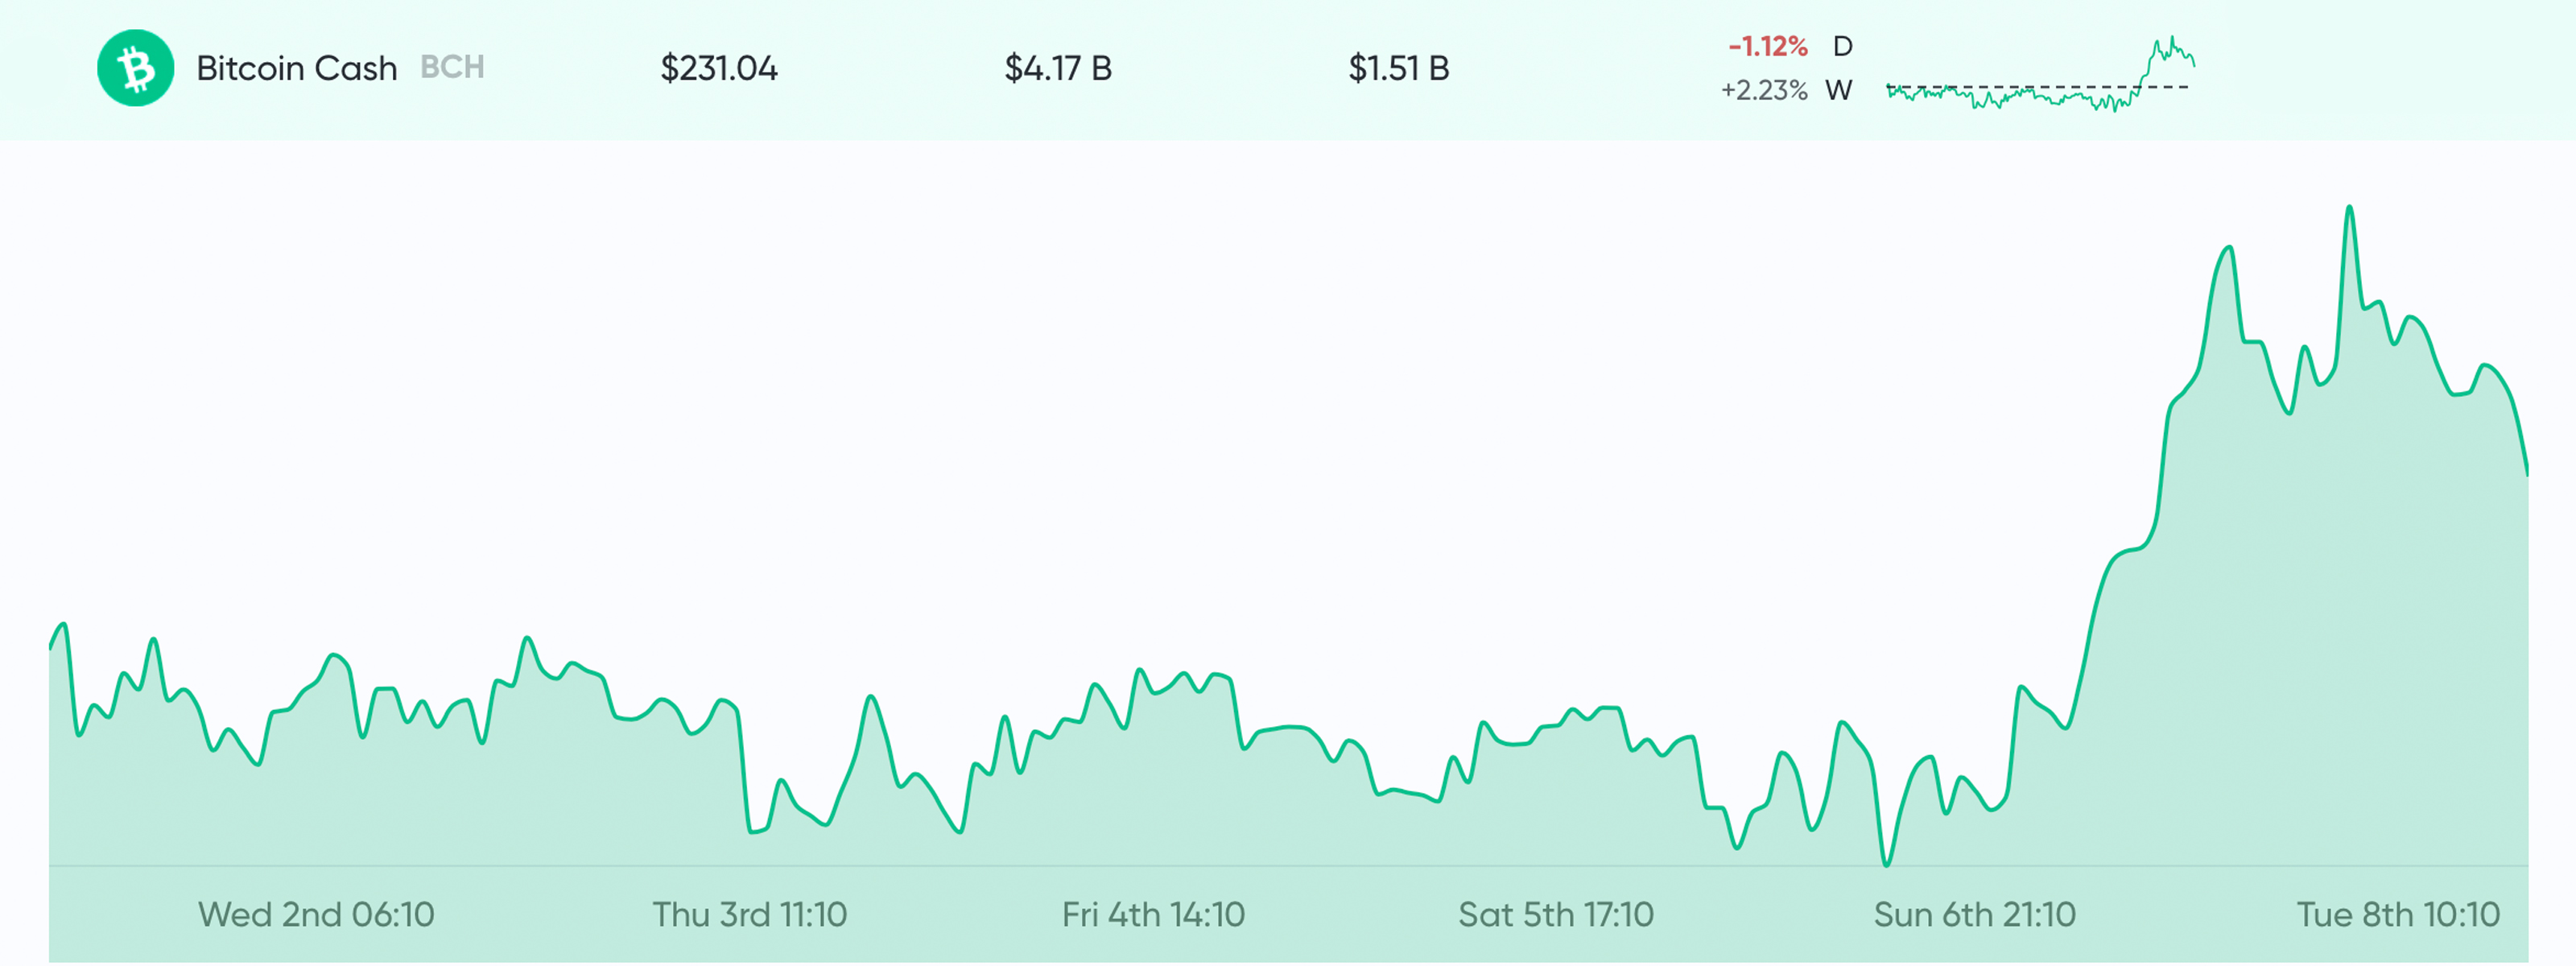
As mentioned above, BCH has managed to capture the number four spot with a market valuation of around $4.17 billion. Bitcoin cash is up 2.2% for the week but is down 1% at the time of writing. One BCH is swapping for $231 per coin and there’s around $1.51 billion in global trades today. This puts BCH in seventh position as far as global volume is concerned, just below XRP and above TRX. Data shows the top trading pair with BCH today is tether (USDT) capturing 61% of all trades. This is followed by USD (14%), BTC (13.9%), ETH (6.4%), KRW (2%), JPY (0.47%), and the EUR (0.46%). One interesting fact for BCH is that the SLP-based stablecoin USDH has outpaced USDC pairs against bitcoin cash. On October 8, USDH accounts for 0.19% of all BCH trades.

Fxstreet market analyst John Isige wrote on Monday that BCH/USD bulls have returned their focus on the $250 and $300 range. “The 50 SMA is breaking away from the longer-term 100 SMA to show that the buyers are largely in charge — A short-term trendline is in line to offer the much-needed support to pull BCH above $250 and further towards $300,” Isige explained. “The full stochastic oscillator is making a re-entrance above 70 (overbought region) signifying an improving technical picture and stronger momentum.”
Bitwise Researcher Believes a Bitcoin ETF Is Imminent
Bitwise head of research Matt Hougan believes a bitcoin exchange-traded fund (ETF) is closer to reality than ever before. The U.S. Securities and Exchange Commission (SEC) plans to make a decision on whether it will approve a bitcoin-based ETF from Bitwise Investments. Hougan says he’s optimistic in regards to the Bitwise Bitcoin ETF Trust being approved and he believes it will be a milestone.

“We’re closer than we’ve ever been before to getting a bitcoin ETF approved,” Hougan said during an interview on Monday on CNBC’s ETF Edge broadcast. “Sometime before Monday, the SEC has to give its decision: yes or no. They have no more ways to postpone it at this point,” Hougan insisted. “We will hear clearly between now and Monday what they think, and then, depending on what we hear, we’ll go forward from there. But it should be a very exciting week.” Many speculators think that the upcoming ETF decision is directly attributed to the rise in crypto prices. After rejecting countless bitcoin ETF attempts in the past, the SEC plans to make its decision on the Bitwise ETF on October 13, 2019.
Renko Patterns Show Continued Downtrend
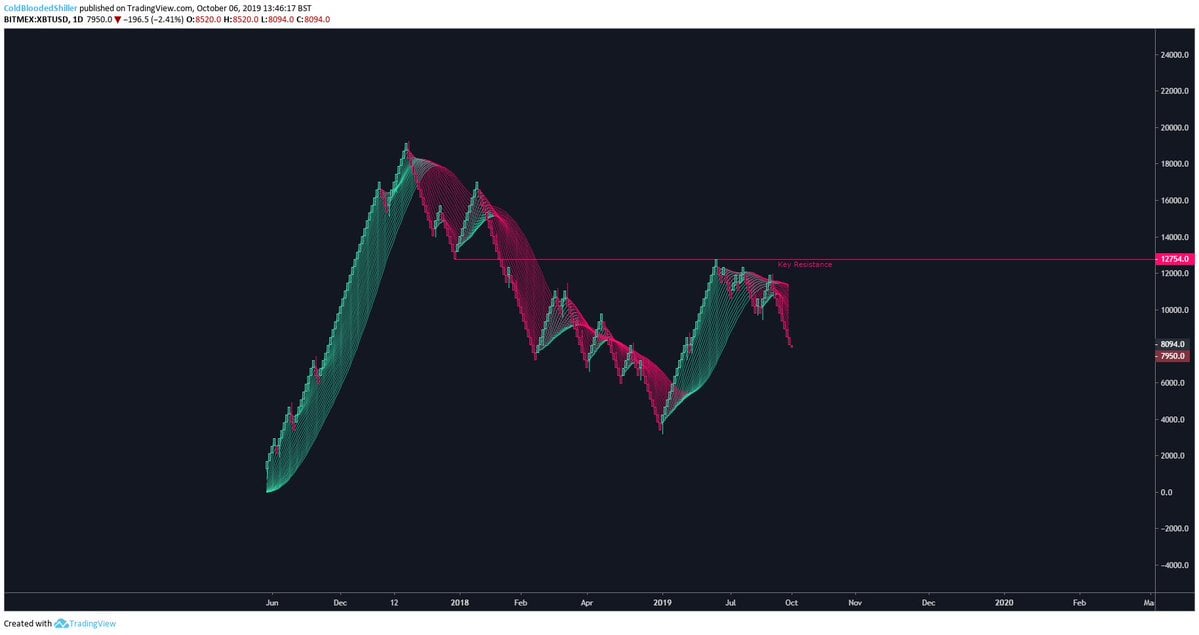
The crypto analyst known as Cold Blooded Shiller believes BTC prices will continue following the downtrend which started after prices attempted to surpass the $14K mark and then consolidated around the $9,500 to $10,500 zone. While sharing a chart showing the BTC daily Renko, Shiller said the “downtrend is in full swing.” Renko charts, however, are unconventional and they are used to track the price movement in contrast to intervals of time. Rengas or brick patterns are added to the chart when the price moves toward a specific target and shows an interesting perspective of market outlooks. Some traders believe in Renko patterns because they sift out unnecessary price movements.

Monetary Easing, Safe-Haven Assets, and 2019’s Market Performances
Despite all the scary headlines and central bankers like the Federal Reserve initiating a domino effect of monetary easing practices, some economists believe the economy is not that terrible. For instance, in the U.S. an investment strategist at BCA Research, Doug Peta, told the public that the labor market “remains vibrant enough to exert downward pressure on the unemployment rate, and services continue to expand despite the contraction in manufacturing, both here and abroad.” This was followed by the U.S. Bureau of Labor Statistics disclosing that the unemployment rate is at its lowest since 1969.

Nevertheless, a few data points do not outweigh the massive number of speculators who believe the economy will falter very soon. This has put the spotlight on safe haven assets like gold, which remains above the $1,500 spot price per ounce. However, even with the year-long gold rally seeing prices spike by 20%, Goldman Sachs has called BTC the best-performing asset class in 2019.
Where do you see the cryptocurrency markets heading from here? Let us know what you think about this subject in the comments section below.
Disclaimer: Price articles and market updates are intended for informational purposes only and should not to be considered as trading advice. Neither Bitcoin.com nor the author is responsible for any losses or gains, as the ultimate decision to conduct a trade is made by the reader. Always remember that only those in possession of the private keys are in control of the “money.” Cryptocurrency and gold prices referenced in this article were recorded at 12:00 p.m. Eastern Standard.
Image credits: Shutterstock, Coinlib, Markets.Bitcoin.com, Gold.org, and Pixabay.
Do you need a reliable bitcoin mobile wallet to send, receive, and store your coins? Download one for free from us and then head to our Purchase Bitcoin page where you can quickly buy bitcoin with a credit card.
The post Market Outlook: Leading Cryptocurrencies Attempt to Break Resistance appeared first on Bitcoin News.

Bitcoin.com is author of this content, TheBitcoinNews.com is is not responsible for the content of external sites.
Our Social Networks: Facebook Instagram Pinterest Reddit Telegram Twitter Youtube


