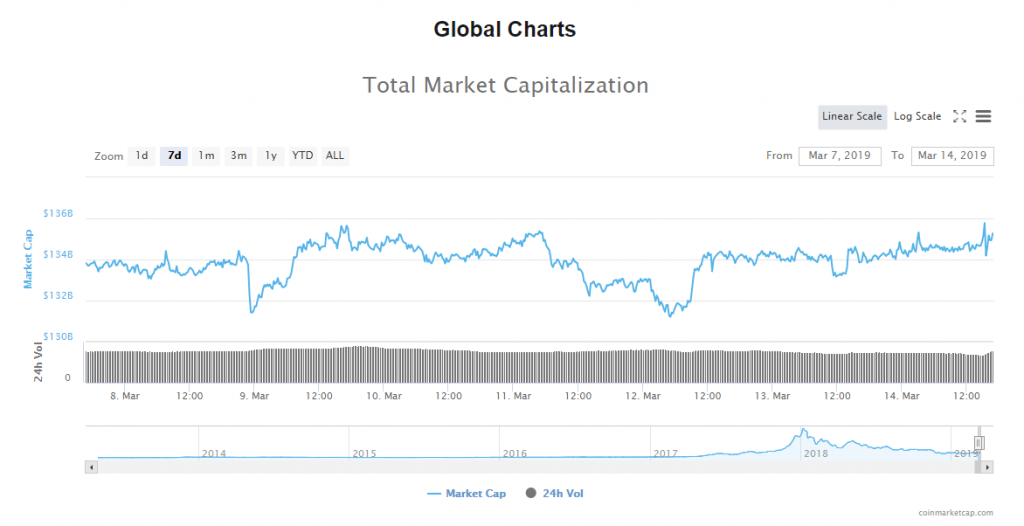
From yesterday the evaluation of the cryptocurrency market cap has continued its slight upward movement and has come up from $133,165,496,430 at its lowest point to $135,775,929,378 at its highest point today.
Trade Bitcoin Automatically with our Trading Bots Guide
Looking at the evaluation chart, we can see that the movement is choppy and indecisive which means that we are most likely seeing further correctional movement. The evaluation is getting close to its upper resistance point at around $135.6B so we could soon see a movement to the downside as the evaluation is to encounter the seller’s territory.
The market is in mixed color today with an insignificant percentage of change as the top 100 coins are ranging around 0.8% on average. The biggest gainers today are Qtum with an increase of 24.64%, Lisk 14% while Aurora is the biggest loser as it is down by 11.45% in the last 24 hours.
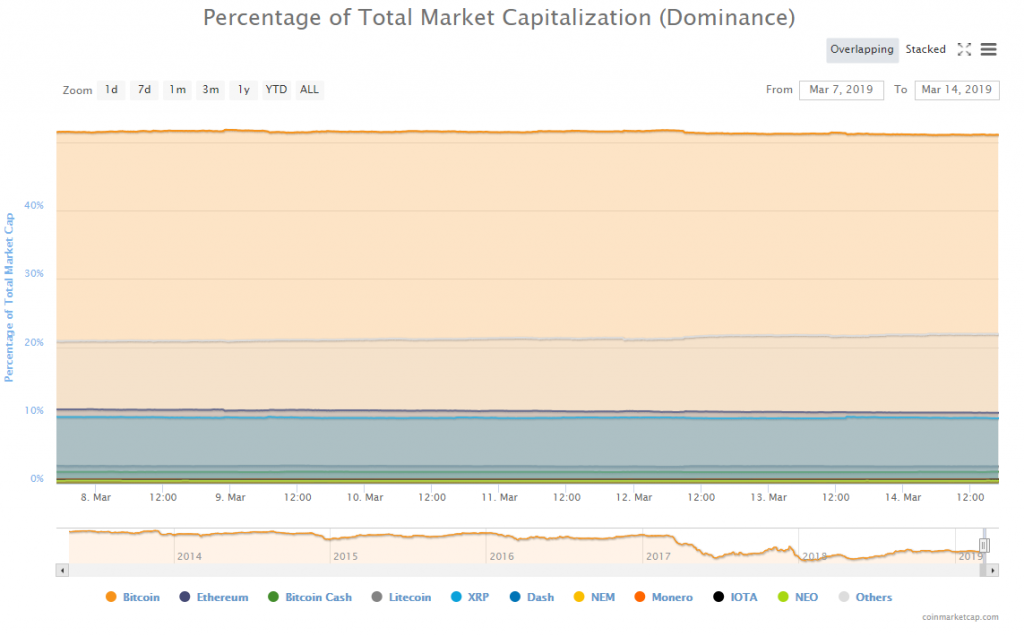
Bitcoin’s market dominance has been decreasing and came down from 51.44% at its highest point yesterday to 51.1% where it is currently sitting.
Bitcoin BTC/USD
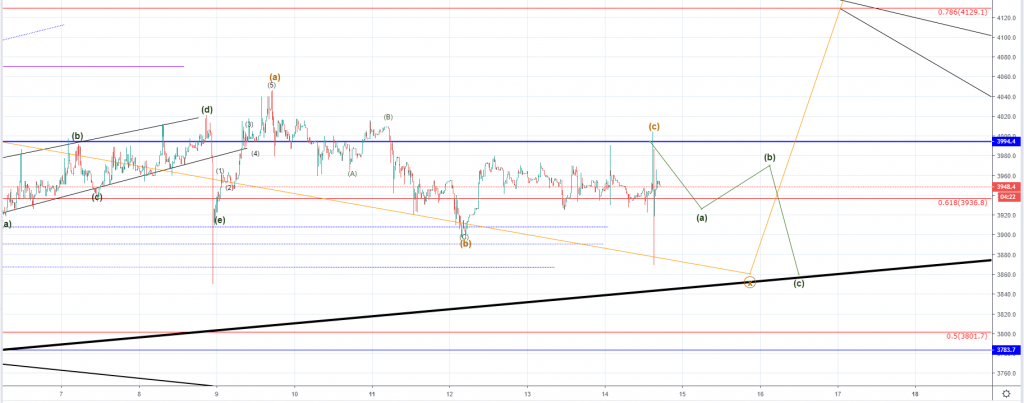
From yesterday’s high at $3966 the price of Bitcoin has decreased by 1.26% at its lowest point today, but managed to recover since and is currently sitting at $3947.5.
Today we have seen the price spike to the resistance level at $3994.4 which was expected as the C wave from the ABC in the opposite direction was set to develop fully. Looking at the 15-min chart we can see that the price spiked to the downside as well coming to $3870 at its lowest point but managed to pull itself back up above the 0.618 Fibonacci level which serves as a support. The spide to the upside was first so we could say that the C wave ended but since the price is moving indecisively and in the same manner, like it did after it got back inside the current horizontal range on Tuesday we could be seeing the prolongation of the sideways movement before the C wave starts.
In either way, I would be expecting a minor decrease from here when the C wave ends to the vicinity of the ascending trendline which is the support line from the ascending triangle in which the price is from 15th of December when the Intermediate correction started. This trendline is to get broken if the Intermediate correction ended as now, in that case, we would be looking at the second corrective wave from a higher degree impulse.
This second structure could also be the prolongation of the mentioned Intermediate correction in which case this would be labeled as the second wave X, but considering the momentum shown on the initial drop of over 10% which ended on 25th of February I believe that it is most likely the start of the impulsive move to the downside. Before any validation on the expected downside move the price is set to move higher from the current levels as to retest some of the significant resistance points above as the Y wave from a Minute WXY correction in the upward facing direction is set to develop.
Market sentiment
Bitcoin is in the sell zone.
Pivot points
S3 3385.1
S2 3664.3
S1 3840.8
P 3943.5
R1 4120.0
R2 4222.7
R3 4501.9
Litecoin LTC/USD
On yesterday’s high when the price of Litecoin was sitting at $57.996 the price started declining and came down to $56.122 at its lowest point today which is a decrease of 3.23%.
Since then the price attempted to recover but failed to exceed the prior high and break out above the current resistance zone inside which it is currently consolidating. Previously we have seen the price going outside the territory of the resistance zone but the encountered resistance above proved to be stronger than the upward momentum which is why the price pulled back inside the territory of the resistance zone again.
On the hourly chart, you can see that the price made an increase to the resistance zone in a five-wave manner and created a rising wedge around those levels as the 5th wave ended as an ending diagonal. Now we are seeing a corrective movement to the downside out of which Tuesday’s increase was most likely the B wave from the ABC three-wave correction which is why after it ends I would be expecting another movement to the downside as the C wave should develop.
This expected move to the downside is set to retest some of the horizontal support levels inside the zone out of which the first significant support would be at around $52.4 which would be the median line and the lower support level would be around $49.236
Market sentiment
Hourly chart technical indicators are signaling a buy. 
Pivot points
S3 24.998
S2 40.100
S1 49.552
P 55.202
R1 64.654
R2 70.304
R3 85.406
Conclusion
The cryptocurrency market has been showing us sideways movement since the 25th of February when the initial drop was made. This drop in prices was expected as previously the Intermediate WXY correction ended and after the drop was made we are seeing this sideways movement which could be the second corrective wave to the upside before a third most powerful one is to start developing to the downside.
First, the prices are to retest their significant resistances like in the case of Litecoin who even exceeded its most significant resistance point and is currently retesting it again from the downside.
In the case of Bitcoin that could mean that the price is to increase to around $4200 level which is the most significant resistance zone for this cryptocurrency and considering that the Bitcoin’s market dominance is still above half of the evaluation of the entire market this could mean that the market, in general, is to see further green days.
It is again worth saying that this upside movement is correctional and that when it ends a strong move to the downside will most likely occur so the prices are going on a decline most probably to their first significant support levels which would in the case of Bitcoin be around $3854 level.
The post Move to the Downside Expected Before Another Increase (Bitcoin & Litecoin Price) appeared first on Blockonomi.

Blockonomi.com is author of this content, TheBitcoinNews.com is is not responsible for the content of external sites.
Our Social Networks: Facebook Instagram Pinterest Reddit Telegram Twitter Youtube


