- There’s an air of uncertainty within the crypto market, with most altcoins plunging lower as Bitcoin continues consolidating
- Analysts seem to be unsure of where the benchmark cryptocurrency will trend in the near-term, as it has yet to make any decisive movements
- One trader is noting that BTC is currently in the process of undergoing a bearish technical cross between two of its moving averages
- He notes that this could open the gates for a move significantly lower, even setting his sights on $9,500
Bitcoin and most altcoins are consolidating as investors remain uncertain about the market’s outlook.
The stock market has been able to stabilize over the past couple of days, which is a positive development that may remove some of the pressure that was previously being placed on BTC.
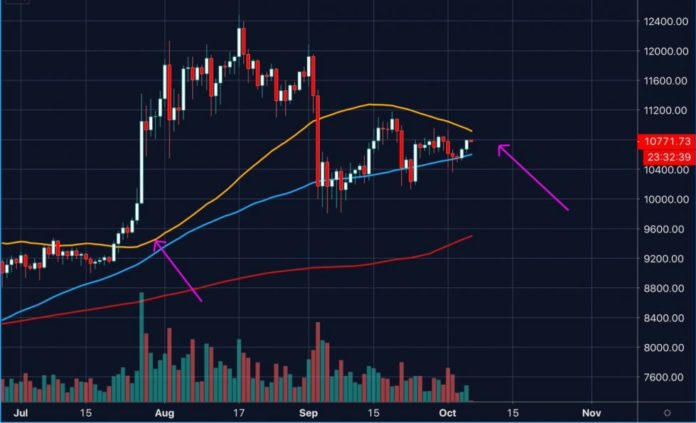
Although it still remains unclear as to where the entire market will trend next, one analyst observed that Bitcoin’s 50-day moving average is currently crossing under its 100-day moving average.
This is known as a bear cross and may indicate that downside is imminent for BTC.
As for where the analyst believes the crypto may trend next, he is setting his sights on $9,500, as there is a technical support level here.
Bitcoin Continues Consolidation Phase as Momentum Stalls
At the time of writing, Bitcoin is trading down marginally at its current price of $10,700. This is around where the cryptocurrency has been trading at throughout the past few days.
Over the past week, the cryptocurrency has been slowly grinding higher, recently breaking out of its previous consolidation range between $10,500 and $10,600.
The break above the upper boundary of this tight range was promising and sparked some momentum, but it proved to be short-lived.
Analyst: This Bearish MA Crossover Could Lead BTC Down Towards $9,500
While speaking about where the cryptocurrency may trend next, one analyst explained that he is now looking towards a downside move towards $9,500.
He points to a bearish crossover between two key moving averages, noting that this could suggest that a move down to its 200-day moving average support is imminent – which sits around $9,500.
“BTC – the last time the MA50 was approving the MA100 they separated bullishly…this time a Bearish cross seems setup given the angle of the MA… note the MA200 around $9500,” he said while pointing to the chart seen below.
Image Courtesy of Big Chonis. Chart via TradingView.
Unless the stock market begins rallying and creates an external catalyst for a Bitcoin pump, its price may soon begin drifting lower.
Featured image from Unsplash.
Charts from TradingView.

Bitcoinist.com is author of this content, TheBitcoinNews.com is is not responsible for the content of external sites.
Our Social Networks: Facebook Instagram Pinterest Reddit Telegram Twitter Youtube


