[OPINION: The views expressed by Investopedia columnists are those of the author and do not necessarily reflect the views of the website.]
I jumped on board the Bitcoin train last year and added it to my research platform. Our clients really enjoy it, whether they are actively trading it or just interested in the product. But of the biggest reasons why I decided to start including it in my weekly analysis is because I saw an opportunity to profit from this market. At the end of the day, isn’t that why all of us are looking at these charts in the first place, Bitcoin or otherwise?
It was April of 2016 and I saw what looked like the completion of a healthy consolidation within an ongoing primary uptrend. So I added it to my arsenal and said let’s do this. My targets up near 660-680 were hit very quickly and even exceeded them. The price of Bitcoin rallied over 60% in the next couple of months following that post. I was hooked!
Bitcoin / USD

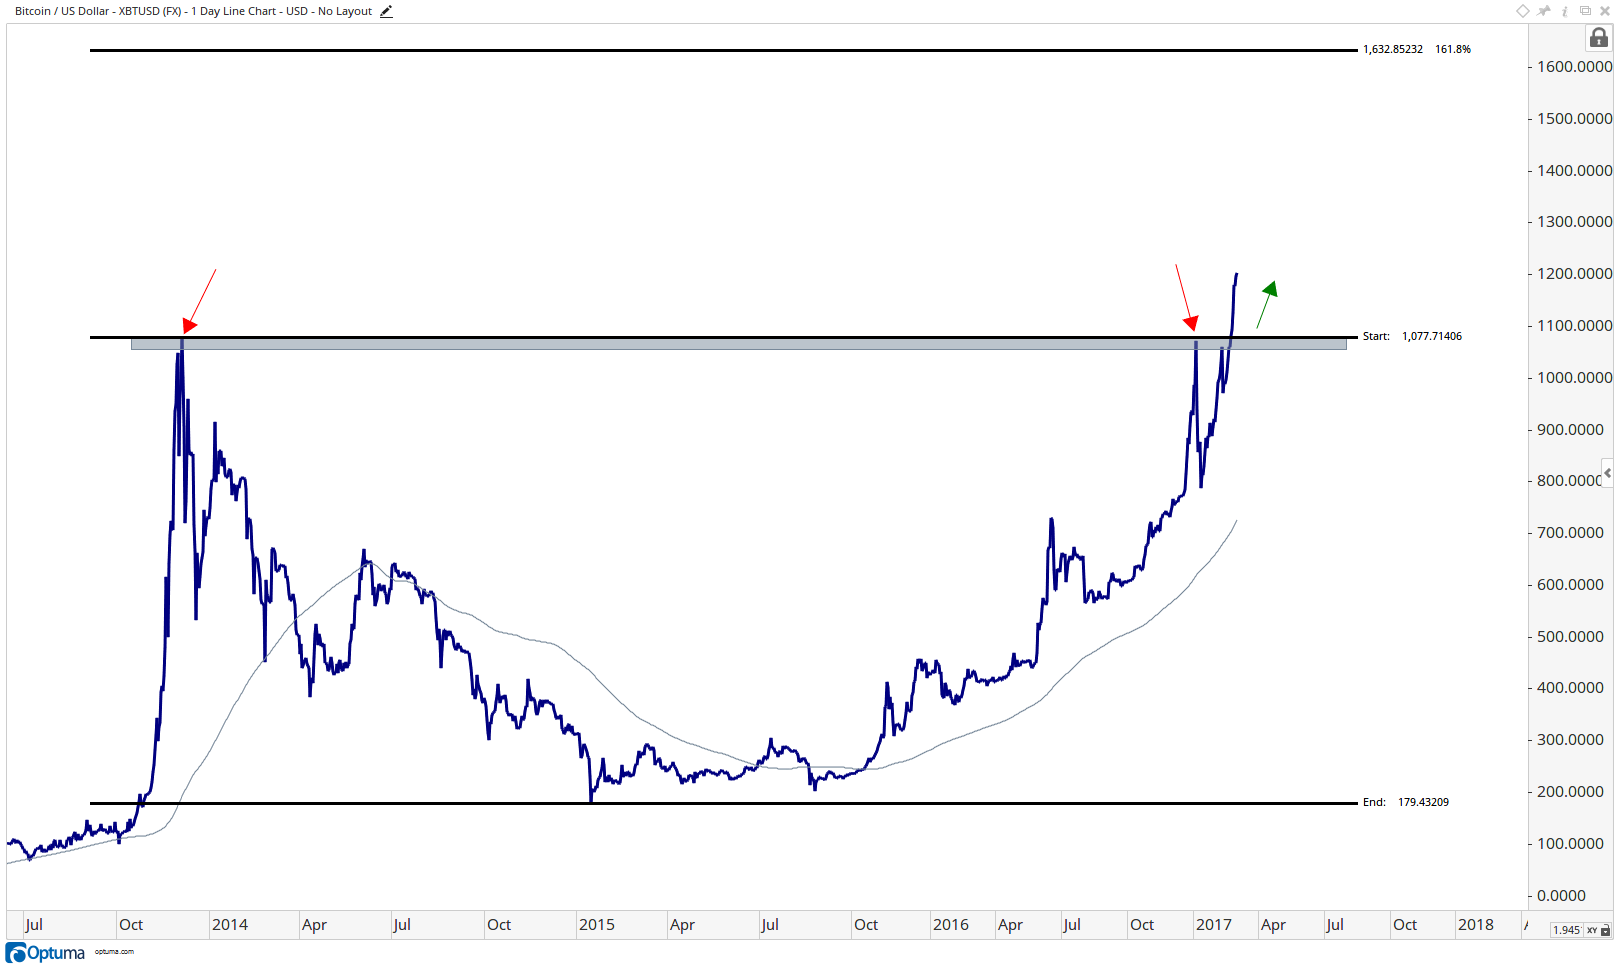
In late October last year, Bitcoin once again was completing a similar consolidation and once again there was every reason to buy. In fact, pretty much the exact same reasons as in April. This next target was the 2013 highs, a logical area of former supply. So the trade was: buy it over 700 and sell into 1075, the former highs.
Bitcoin / USD

Bitcoin / USD (arithmetic scale)


TheBitcoinNews.com – Bitcoin News source since June 2011 –
Virtual currency is not legal tender, is not backed by the government, and accounts and value balances are not subject to consumer protections. TheBitcoinNews.com holds several Cryptocurrencies, and this information does NOT constitute investment advice or an offer to invest.
Everything on this website can be seen as Advertisment and most comes from Press Releases, TheBitcoinNews.com is is not responsible for any of the content of or from external sites and feeds. Sponsored posts are always flagged as this, guest posts, guest articles and PRs are most time but NOT always flagged as this. Expert opinions and Price predictions are not supported by us and comes up from 3th part websites.
Advertise with us : Advertise
Our Social Networks: Facebook Instagram Pinterest Reddit Telegram Twitter Youtube


