


It turns out that nothing really demonstrates the underlying character of the action we have seen over the past month in the cryptocurrency complex like the charts of some of the more volatile large market cap pairings.
For example, we’re going to take a look at the charts for TRX/BTC and XRP/BTC below, which feature some powerful trends that exemplify the importance of Bitcoin as an island in a sea of volatility.
TRX/BTC
Price Analysis
- High: 0.00000325
- Low: 0.00000301
- 24-Hour Volume: 3.996M
- MACD Signal: Sell
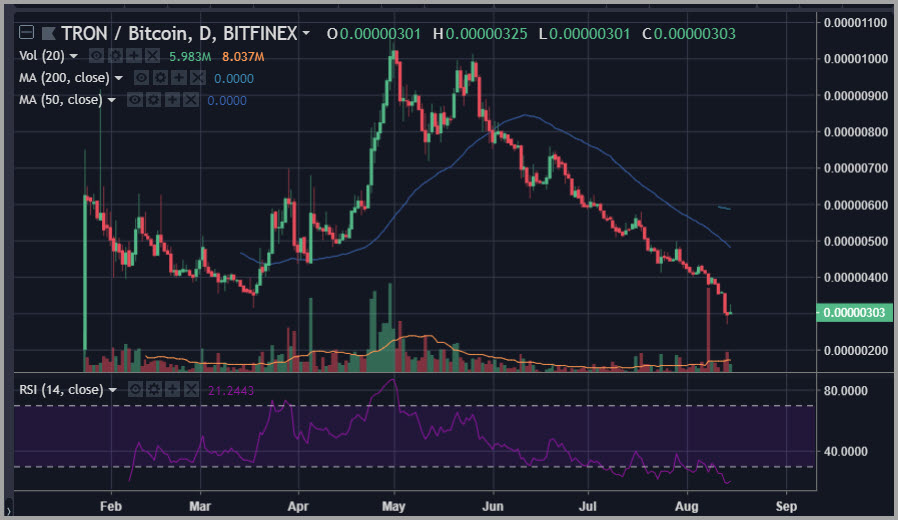
The TRX/BTC pairing features an extraordinarily consistent downward trend on the chart since late April.
The action has been steady and consistent and suggests a gradual liquidation from secondary to primary in this paired relationship, as one might expect during a flight to safety period for accounts denominated primarily in Bitcoin.
That said, by the same token, one might see this TRX/BTC pairing as a potential indicator of sentiment among more serious crypto traders. In other words, TRX/BTC is where we might see the most important inflection when the animal spirits begin to rise again in the cryptocurrency space.
That said, at this point, the TRX/BTC pair remains in a downtrend mode, trading beneath all its major moving averages with major oscillators camped out in deeply oversold territory.
XRP/BTC
Price Analysis
- High: 0.00004753
- Low: 0.00004413
- 24-Hour Volume: 3.449M
- MACD Signal: Sell
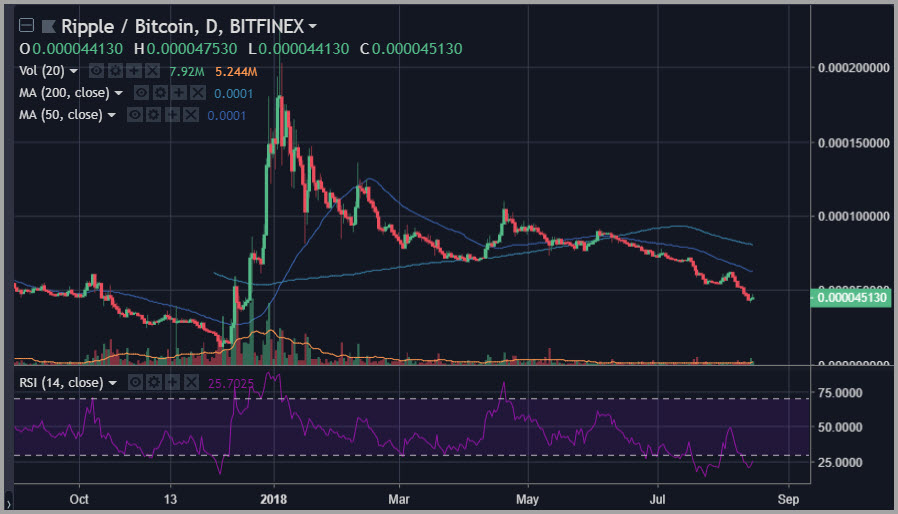
XRP/BTC has been a relatively uninteresting pair since the extraordinary spike we saw to close out 2017. For the most part, this pair has been in a gradual bearish slide that has only recently begun to accelerate as XRP has fallen off the end of a table against just about everything.
One interesting technical signal we see at present on the XRP/BTC chart is a potential bullish divergence on the 14-day RSI, with the print over the last 48 hours reaching a pivot low around the 20 level, which compares with the print under 13 at the pivot low formed in late July.
Since that late July low was at a much higher level on the XRP/BTC chart, the much lower score on the 14-day RSI is a potentially bullish signal of a loss of downward momentum underneath the surface of this chart.
This is certainly something to watch out for given the explosive nature of this pair when momentum comes back in and animal spirits are engaged.
Happy Trading~
To trade cryptocurrencies, sign up with BitMexor Binance!
Disclaimer: This article should not be taken as, and is not intended to provide, investment advice. Global Coin Report and/or its affiliates, employees, writers, and subcontractors are cryptocurrency investors and from time to time may or may not have holdings in some of the coins or tokens they cover. Please conduct your own thorough research before investing in any cryptocurrency and read our full disclaimer.
Image courtesy of Pexels
Charts courtesy of tradingview.com
The post TRX/BTC and XRP/BTC Price Analysis: What Demoralization Looks Like on a Chart appeared first on Global Coin Report.
Read more at https://globalcoinreport.com/trx-btc-and-xrp-btc-price-analysis-what-demoralization-looks-like-on-a-chart/

Globalcoinreport.com/ is author of this content, TheBitcoinNews.com is is not responsible for the content of external sites.
Our Social Networks: Facebook Instagram Pinterest Reddit Telegram Twitter Youtube


