

BTCManager’s Weekly Cryptocurrency Outlook highlights the price action and technical indicators on a long-term basis to identify the best opportunities in the largest cryptocurrencies, such as bitcoin, ether, and others.
BTC-USD (Bitstamp)
BTC-USD went on to post a fresh all-time high at $6316.85 over the weekend and the monthly candle looks to close firmly in the upper third of October’s price range.
The weekly price action shown below indicates the bullish saucer is still in play, as the Awesome Oscillator remains green and in an uptrend. However, we have seen two consecutive weeks of long lower wicks, indicating bears took a strong attempt at moving the market lower. Again, a hanging man candlestick variant formed last week, suggesting immedaite support at $5967.38; a move below this level might see a large downward move to test lows near $5366.00 or $5101.36.
The conversion line (blue) indicats that the uptrend would still be intact even with a move to $4644.43. The flattening of the conversion line suggests the market will be attracted to this level and could provide a chance to ‘buy the dip.’
If BTC-USD fails to achieve a new high above $6316.85 by November 14, the current record high count will be invalidated, with just four near consecutive highers highs since the low at $2972.01 from September.
However, when looking at the daily Renko chart, we see that the bullish surge may continue to $6800, as illustrated below, before a pullback by at least $700. For instance, we see that the previous Renko candle high was broken October 12 and we have yet to reach the first Fibonacci extension level at $6778.22.
The chart above shows that the uptrend should reach at least $6778.22. Until we get a red Renko candle, long-term sell positions are not recommended. For instance, a daily close below $5363.52 would indicate a change in trend using the Renko charts (and a signal to enter a sell position). The bullish signal was given in early September when the first green Renko appeared after a series of redcandles, which gave an entry near $4000.
ETH-USD (Kraken)
As Bitcoin regained the $6000 handle, ether has been able to move back above $300. The 4-hour chart displayed below shows a somewhat bullish outlook for ETH-USD ahead of devcon three. Firstly, the chart shows a bullish Ichimoku cloud breakout, with the market moving above the red cloud; also, the cloud projected forward is green and is starting to turn upward. The conversion line (blue) is also moving higher suggests the market will continue to rise and we should look for the conversion line to carry on its uptrend.
On the other hand, support stands at $301.50 as indicated by the base line (red). Moreover, the flat lower span of the green Ichimoku cloud suggests an important support at $294.84 for the week ahead.
Looking at the weekly chart below, we see the outlook is not as bullish. While the market managed to close above the conversion line (blue), a fractal resistance will form at $349.50 unless there is a move above this level this week. In short, if the fractal sell level forms on November 6, we could see a drift toward $200, the equilibrum zone indicated by the cloud.
On the other hand, a move above $349.50 will invalidate the fractal forming and the market will then look to establish new highs near $400. But the converison line has moved lower this week, suggesting slightly more weight to the downside. This is further supported by the Awesome Oscillator which remains red in color and beginning to move lower.
The weekly Renko charts (displayed below) show an interesting picture. A double top occurs at $325.92, suggesting a break above this level will see an extended move toward the all-time high. A weekly close higher than $380.24 is required for a new green Renko to form and to give stronger confirmation of a breakout.
LTC-USD (Bitfinex)
Litecoin looks to head south after a fractal resistance forms at $70.364 at the beginning of this week. Another bearish indication is given by the conversion line (blue) which is moving south and looks to cross below the base line (red). Last week’s close managed to stay above the support at $54.93, but this week looks to close below the base line, i.e., $55.65. Notice that the Awesome Oscillator is red and moving lower, suggesting downward momentum may being to dominate. Now the market will find a new support, with the most recent fractal buy level at $32.454. Therefore, we look to sell near $57-$58 anticipating a long-term drift lower.
The conversion line proides resistance at $57.77, with a weekly close above this level considered bullish.
The chart below for LTC-BTC shows a bearish outlook for the altcoin, with a Kumo breakout to the downside and the lagging line (purple) moving below the previous price action. The most recent fractal support left is 0.00302185, a long way down from the current 0.009. The Awesome Oscillator has also turned negative, suggesting bears will start to exert their control.
BCH-BTC (Bitfinex)
As indicated in our previous market outlook, the bullish signal on the daily timeframe for BCH-BTC materialized into a bullish move over Oct 27-29. However, buyers have been cut short of reaching 0.1000 an important psychological resistance. The daily chart below shows that more upward moves are to be expected, as the Awesome Oscillator is near the zero bound, remains green and once above zero, bullish momentum will begin to dominate.
We look for BCH-BTC to make its way through the resistance zone as shown below as the SegWit2x hard fork unfolds. The Ichimoku cloud also looks to be changing color from red to green, once coconfirmed, then we cooud see further moves to the upside and an attempt at 0.1000.
However, we could also see a move below the conversion line, or see the market rejected from the resistance zone (red cloud), which will give indications to sell and motivate a bearish outlook. Also, the doji candlestick that formed on October 29 looks to form a fractal resistance, which will in turn lead to some bearish momentum in the days ahead.
XMR-USD (Kraken)
Monero has been tempered by the Fibonacci retracement level at $93.71 acting as resistance, and the base line with last week’s close below $90.92, suggesting we could see the market attempt the Fibonacci support at $78.09. The conversion line moves lower this week, suggesting more likelihood of a move lower in the days to come. XMR-USD needs to regain and hold above $94.50 for a bullish outlook over the long term.
The lagging line (purple) indicates immediate support at $86.15 and resistance at $94.50.
Looking at XMR-BTC, we see the market is still within the equilibrium zone, suggesting the cryptocurrency pair may be finding support in this region before moving higher. Notice that the lagging line (purple) is within the Ichimoku cloud 26 periods back; if this line moves below the cloud, it will give strong confirmation that a downward trend will begin. Nevertheless, we should not rule out a breakout in either direction.
VTC-USD (Bittrex)
Vertcoin has reached fresh highs above $5 this week, galvanizing on its gains made over October. The December halving is approaching and it seems that the market is starting to price the event in. Bullish momentum is expected to continue, as the volumes for the altcoin have grown significantly, almost matching monero over the past 24 hours. Increased volume points to more market participants wanting in, and volume precedes price, so the inflow of new volume paints a bright future for the price of vertcoin over the next few days.
The monthly chart for VTC-USD is shown below, and the altcoin reached a high of $5.69 last week. As indicated in our price analysis on September 5, the Fibonacci extension targets lie at $5.56, $4.75, $3.44 and $2.13. Since the upper extension target at $5.56 has been achieved, we expect to find support around $4.75. Therefore, we should set limit buy orders around $4.75 and $3.44 in case of a cool off.
Also, October’s candlestick looks to form a variant of the bullish Marubozu, so we can calculate the 50 percent level of the candle’s body and this level will provide important support, along with the open price of $1.0354. We can also set buy orders near these levels, as the chart shows October’s gains are the largest ever in one month, suggesting bulls are firmly in control and that the open and 50 percent support levels will be very strong subsequently.
However, if the uptrend continues above $5.56, we look to target (at least) the 2014 high, $7.1925, before taking some profits from a long position on vertcoin.
The weekly price action is displayed below, and illustrates that the market is searching for a new ceiling and will establish a new fractal resistance. Where exactly, it is hard to say, but we can tell that the uptrend may not even be half way through yet. Consider the most recent fractal support at $0.7814 (early October). Since then, the market has gone onto make two near consecutive higher highs, meaning that we could see as many as eight more weeks until bulls become exhausted. Alternatively, the count will be invalidated if we see no new high above $5.6908 by November 14.
The conversion line (blue) indicates short-term equilibrium just bove the $3.00 handle and could be a potential buy zone over the long term. Once the market establishes a new fractal resistance, we can use the Fibonacci retracement tool to identify entry points into buy positions.
VRC-USD (Bittrex)
The weekly chart below shows a strong bullish signal for Vericoin (VRC), that is the bullish saucer, which was triggered on October 30 as the market breached above last week’s high at $0.475875. A break above the high from last week gives an entry signal and indication to buy vericoin, as upward momentum is just starting to take hold and we could see a long-term uptrend targeting the base line (red) around $0.9484. Moreover, the most recent fractal resistance lies at $0.4845 and a weekly close above this level will give an even stronger confirmation.
The next two resistances as indicated by fractals are at $0.5576 and the 2017 high at $1.7764, signaling plenty of room for an upside movement. Also, notice for the past six weeks or so, the conversion line (blue) has held firmly as resistance, however, this week, the market has breached the resistance at $0.3936. A weekly close above the conversion line will give a strong bullish signal and increase the probability of a move toward $1.00.
Finally, the lagging line suggests that once there is a clean break of $0.4798, there is no expected resistance given by this indicator, which also supports a large move to the upside and opens up the $1 psychological level. To confirm a break of this important resistance, we require a weekly close above $0.4798.
Market Snapshot
The snapshots below show the top 10 cryptocurrencies by market capitalization and 24-hour volume.
Market Capitalization
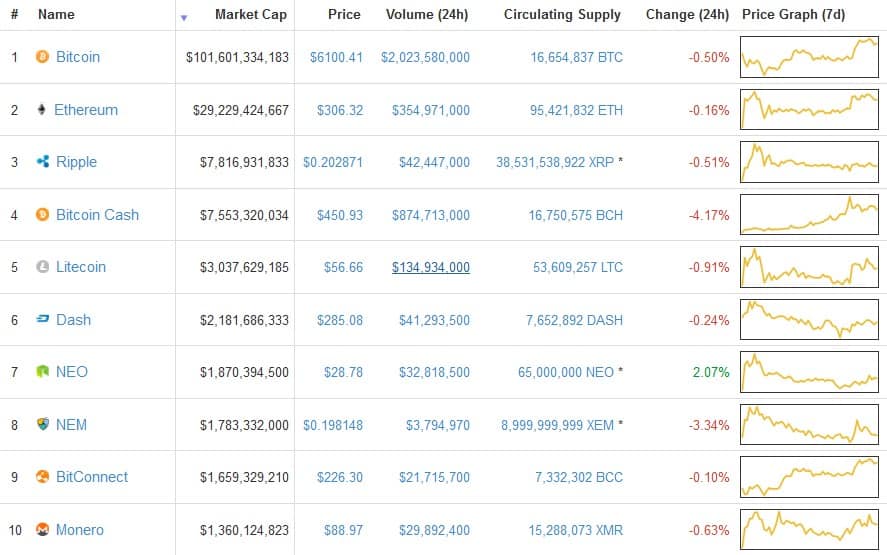
*WARNING: BitConnect is a Ponzi scheme
24-hour Volume
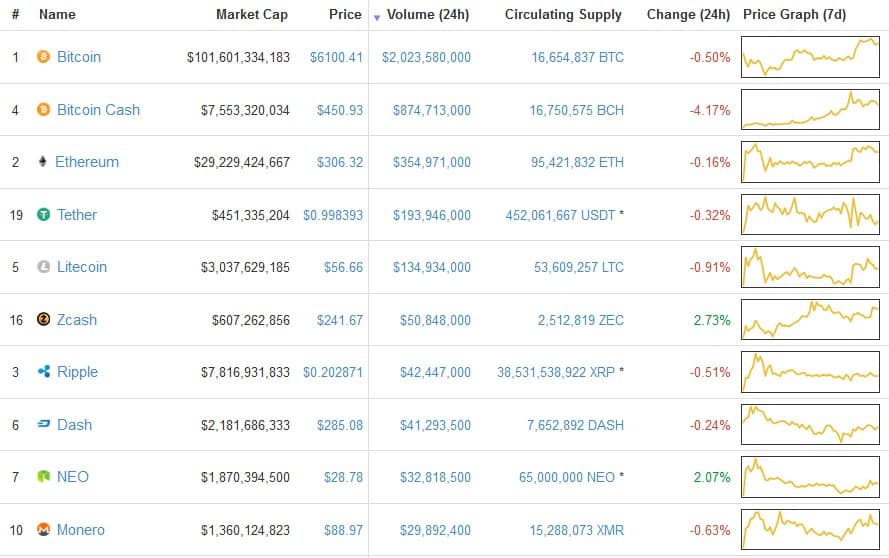
Source: Coinmarketcap

Btcmanager.com is author of this content, TheBitcoinNews.com is is not responsible for the content of external sites.
Our Social Networks: Facebook Instagram Pinterest Reddit Telegram Twitter Youtube


