While the action across the cryptocurrency complex has been pervasive to the downside over the past 10 days, the picture that has been created on the charts varies powerfully from coin to coin in terms of where this leg of the trend fits into the jigsaw puzzle of the larger pattern characterizing the bear market underway so far in 2018.
This nuance is profoundly exemplified by a comparison between the charts for XRP and Bitcoin (BTC), as we shall see below.
XRP
Price Analysis
- High: $0.3574
- Low: $0.33081
- 24-Hour Volume: $355.75M
- 7-day Percent Change: -23.08%

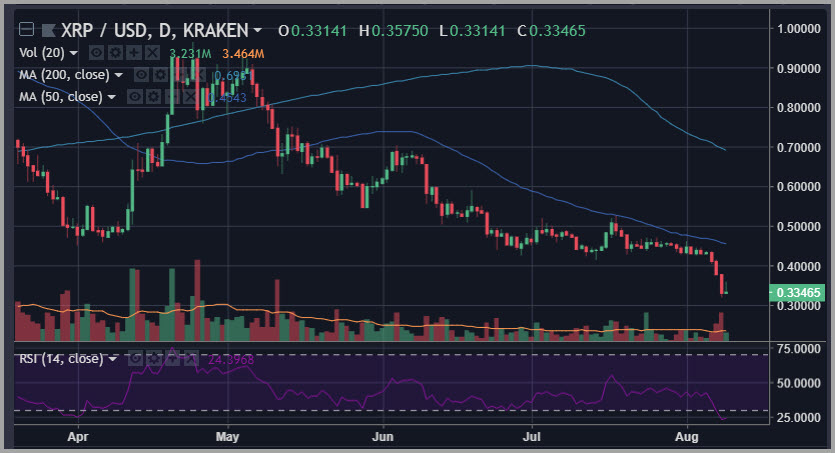
XRP has been perhaps the poster boy for the brutality of the downside we have seen over the past week, with this move representing a vicious break of support leading to a great waterfall decline.
The downside was triggered for XRP when it broke a support level formed over the course of six weeks of persistent last-ditch holds at the $0.43 level. When that level finally gave way amid selling across the complex, positions that had been built up by accumulation at that level began to be thrown overboard without care for cost basis or execution price.
The support level we picked out as most obvious several days ago was at the $0.30 level. While we haven’t seen this level tested yet, it would take only a slight extension of the downward move to trigger that test and put this critical level into play.
For now, we must consider this trend in place and respect that view until we see technical signals in XRP that demonstrate either a more severe capitulation or the presence of stronger handed buyers sitting on the bid.
Bitcoin (BTC)
Price Analysis
- High: $6378.6
- Low: $6239.9
- 24-Hour Volume: $4.93B
- 7-day Percent Change: -17.02%

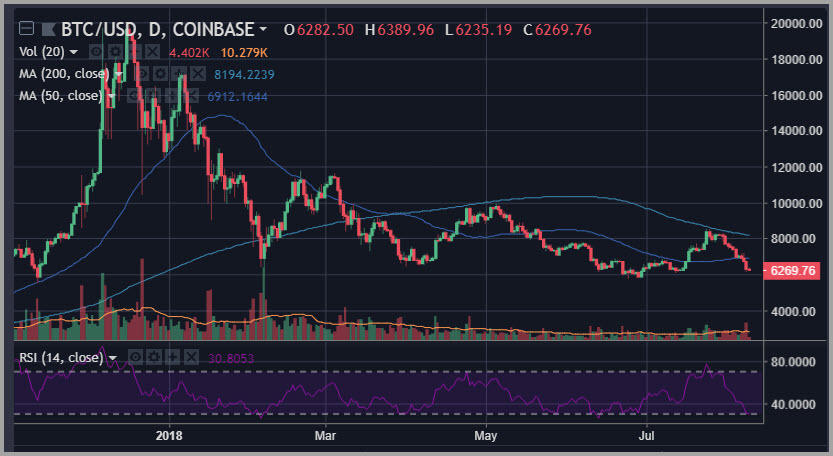
By contrast to the action in XRP, Bitcoin (BTC) remains solidly above its recent bear market lows established at a pivot formed toward the end of June.
The key level in play here at this point is the one we picked out over recent days at the $6100 level.
At this point, Bitcoin (BTC) has clearly broken key support levels along the way, such as a rising 50-day simple moving average now back above at the $6800 level.
That said, we have also seen the triggering of clear oversold levels in many different oscillators, including the 14-day RSI on the daily chart and to the MACD indicator on the hourly chart.
Given that these oversold oscillator readings are coming in confluence with the key $6100 support level, traders looking for a speculative bounce position may already have their signals in place for a move back up to test the $6550 level just above.
Should we see downside momentum reassert itself in BTC, then all eyes will be on the $5750 level as the only thing standing between this chart and new 2018 lows.
Happy Trading~
For the latest cryptocurrency news, join our Telegram!
Disclaimer: This article should not be taken as, and is not intended to provide, investment advice. Global Coin Report and/or its affiliates, employees, writers, and subcontractors are cryptocurrency investors and from time to time may or may not have holdings in some of the coins or tokens they cover. Please conduct your own thorough research before investing in any cryptocurrency and read our full disclaimer.
Image courtesy of Pexels
Charts courtesy of tradingview.com
The post XRP Bitcoin (BTC) Price Analysis: The Jigsaw Puzzle appeared first on Global Coin Report.
Read more at https://globalcoinreport.com/xrp-bitcoin-btc-price-analysis-jigsaw-puzzle/

Globalcoinreport.com/ is author of this content, TheBitcoinNews.com is is not responsible for the content of external sites.
Our Social Networks: Facebook Instagram Pinterest Reddit Telegram Twitter Youtube


