


Long-Term Outlook:
XRP Weekly Chart – Source: Tradingview.com
A look at the Weekly chart for XRP shows that price is trading at $0.3, slightly above the support area near $0.28.
Last week’s candle was an inverted hammer with a very long upper wick, indicating that the bears are trying to gain control.
The RSI is at 41, indicating neither oversold nor overbought conditions.
Price is trading below the 21 and 50-period moving averages and the Ichimoku cloud, the former of which is falling sharply.
On a more positive note, the MACD has just made a bullish cross and has started to move upward.
Given this information, I am undecided on the long-term prospects of XRP.
Medium-Term Outlook:
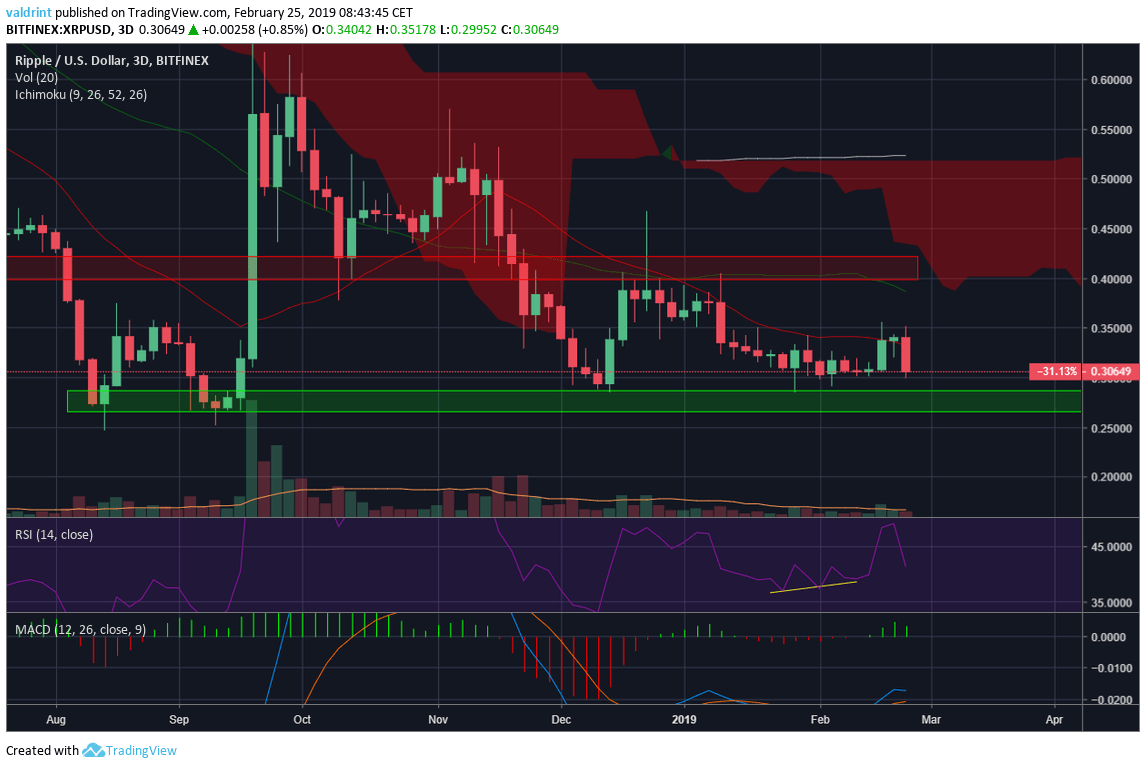 XRP 3-Day Chart – Source: Tradingview.com
A look at the 3-day chart shows that price fell sharply after reaching the resistance offered by the 21-period MA.
Similar to the weekly chart, the price is trading below all the moving averages and the Ichimoku cloud.
The MACD is starting to lose its power and possibly setting itself up for a bearish cross.
However, there is significant bullish divergence developing in the RSI.
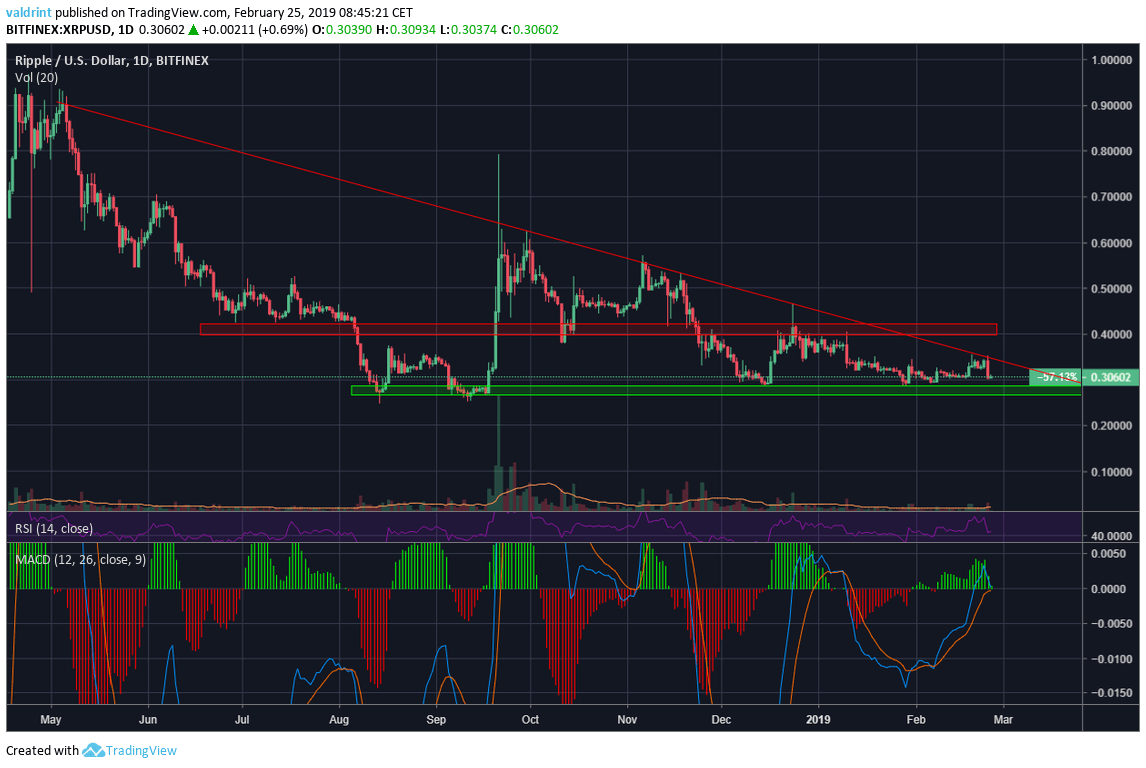 XRP Daily Chart – Source: Tradingview.com
A look at the Daily chart shows that price tried unsuccessfully to break out of the resistance line in place since May 2018.
The daily chart also gives us the minor resistance area near $0.4 and the support area near $0.28.
The MACD has lost all of its power and is very close to making a bearish cross.
Given this information, I am leaning on bearish for the medium-term, especially if a break below $0.28 occurs.
However, at this point, the market looks very undecided.
Short-Term Outlook and Price Prediction:
 XRP 6-Hour Chart – Source: Tradingview.com
A look at the 6-hour chart shows that price fell sharply after making a double top accompanied by a bearish divergence in the RSI.
The drop occurred at a very significant volume.
The MACD is negative and falling sharply.
However, the price is currently trading right on the support line in place for 28 days.
It is of utmost importance to keep an eye on whether price breaks down from this level.
Price Prediction:
I believe that price will rebound to the $0.33 level over the next 3-4 days before ultimately showing its hand and making a strong move.
Conclusions:
- Price is trading below the long-term moving averages.
- Price failed to break out of the resistance line in place since May 2018.
- Price is trading right on the short-term support line.
Latest Ripple News:
| DISCLAIMER: Investing or trading in digital assets, such as those featured here, is extremely speculative and carries substantial risk. This analysis should not be considered investment advice, use it for informational purposes only. Historical performance of the assets discussed is not indicative of future performance. Statements, analysis, and information on blokt and associated or linked sites do not necessarily match the opinion of blokt. This analysis should not be interpreted as advice to buy, sell or hold and should not be taken as an endorsement or recommendation of a particular asset. |
RELATED ARTICLES
MORE FROM OUR PARTNERS
Advertisement
blokt.com is author of this content, TheBitcoinNews.com is is not responsible for the content of external sites.
Our Social Networks: Facebook Instagram Pinterest Reddit Telegram Twitter Youtube


