


After crossing the resistance at $0.45 yesterday, XRP is again showing a bearish trend.
Tron, after kicking up a bullish trend is again showing downtrend so far today.
Ripple (XRP/USD)
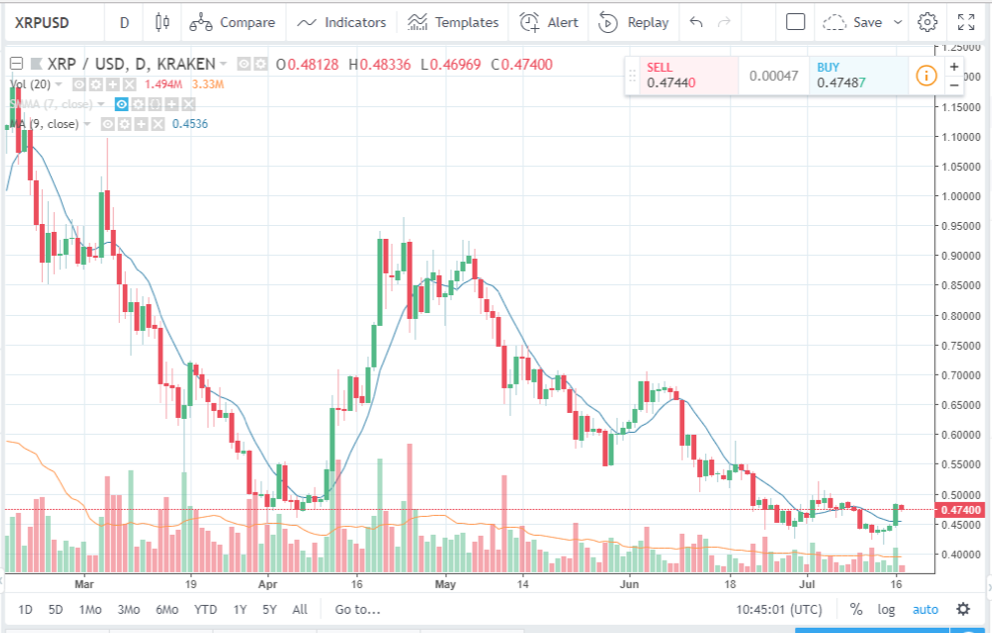
Price Analysis
- High: $0.4833 USD
- Low: $0.4696 USD
- Major Resistance Level: $0.50
- Hourly MACD: Placed slightly in the Sell region.
Yesterday, Ripple had experienced a surge from approximately $0.446 USD to nearly $0.482 USD. The price of XRP/USD however, had fallen today, 17th July 2018 so far. At the time of writing the price of Ripple (XRP) is showing $0.4740 USD. This has created a pressure among the sellers and placed the crypto coin in the Sell zone slightly. But, the good thing is that at the time of writing, the XRP/USD pair had not yet fallen below the $0.4700 support area of yesterday.
Ripple (XRP) had been trading in the green since 13th July 2018 but was unable to break the major resistance level at $0.4500. Yesterday the cryptocurrency had crossed that level and the high was approximately $0.4834 USD (coinmarketcap.com). The moving average indicator (the blue line), at the time of writing, is showing approximately $0.4536.
Tron (TRX/USD)
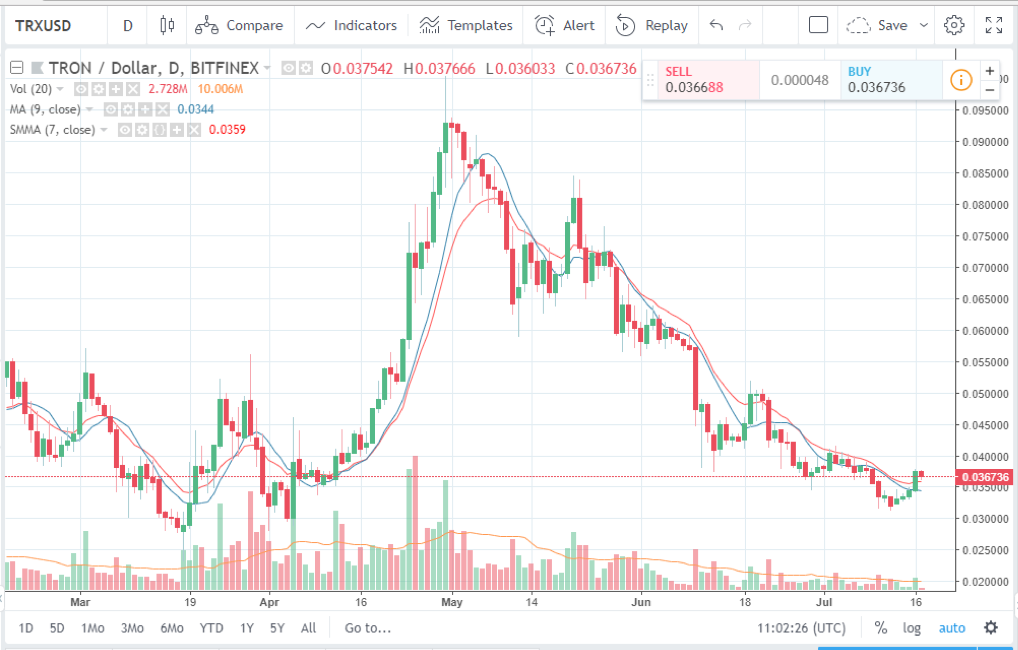
Price Analysis
- High: $0.0376 USD
- Low: $0.0360 USD
- Major Resistance Level: $0.40
- Hourly MACD: Placed slightly in the Sell region.
The TRX/USD pair on 16th July had shown a slight stronger uptrend movement with the price ranging from nearly $0.0342 USD to $0.0374 USD. But, today on 17th July 2018, the price action of Tron (TRX) is showing a bearish trend so far. The price of the crypto coin, at the time of writing, is showing approximately $0.0367 USD. Yesterday, as the coin was showing a slightly stronger uptrend, there was a pressure on the buyers and it was placed in the Buy zone. However, today, the decline so far has created a pressure on the sellers and the crypto coin has slightly moved into the Sell region.
Tron had broken through the resistance levels $0.035 and $0.036 yesterday itself and as of yet has maintained its position slightly above these two resistance lines. However, the moving average line (blue) at the time of writing marks 0.0344. Let’s take the major resistance level at $0.04 and wait and see whether the pair crosses it by gaining a little stronger uptrend (like the one yesterday).
Yesterday the price of the XRP/USD and TRX/USD had probably seen such a rise because of the BlackRock news regarding Bitcoin and other cryptocurrency markets. BlackRock has formed a working group to look into the blockchain infrastructure and the cryptocurrencies. Otherwise, both the coins mentioned here were showing slight green signals but were unable to form a strong uptrend. So, it is not surprising that XRP and Tron are both showing bearish signs today so far.
Happy Trading!!
For the latest cryptocurrency news, join our Telegram!
Disclaimer: This article should not be taken as, and is not intended to provide, investment advice. Global Coin Report and/or its affiliates, employees, writers, and subcontractors are cryptocurrency investors and from time to time may or may not have holdings in some of the coins or tokens they cover. Please conduct your own thorough research before investing in any cryptocurrency and read our full disclaimer.
Image courtesy of Pexels
Charts courtesy of tradingview.com
The post XRP, Tron Price Analysis: What’s Happening? appeared first on Global Coin Report.
Read more at https://globalcoinreport.com/xrp-tron-price-analysis-whats-happening/

Globalcoinreport.com/ is author of this content, TheBitcoinNews.com is is not responsible for the content of external sites.
Our Social Networks: Facebook Instagram Pinterest Reddit Telegram Twitter Youtube


