It’s been a difficult and challenging environment throughout the cryptocurrency universe these past 5-6 months after a stellar 2017 trading campaign as selling pressure has dominated the action and in the process, inflicted meaningful technical damage across the board.
While the recent downside pricing pressure has left none unscathed and wrecked havoc from a technical perspective, whereby numerous names find themselves in a poor technical posture trading below their 50 and 200 day moving averages, we’ve been noting in recent reports that we suspected that some short-term relief would likely be in store and bring to a halt some of the recent bleed lower for the time being.
For example, just a few short days ago, we noted in our report of Monero (XMR) that, “while we certainly suspect some short-term price relief in the days/weeks ahead, the technical damage inflicted during the past several weeks throughout the entire cryptocurrency universe requires time and repair”, which remains the case today.
Nonetheless, both investors and traders alike are now finding that long-awaited relief at last as the slippery slope south has seemingly subsided where we are now being treated to some upside action as can be witnessed from the Charts of BTC; ETH; LTC and BCH below:
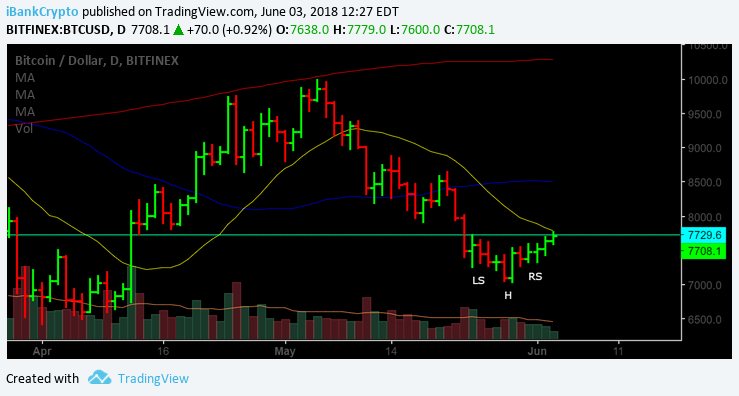
As we can see from the daily Chart of Bitcoin (BTC) above, BTC is once again forming a potential mini inverted H&S formation and attempting to move up-and-out. Although BTC remains well below its 50 (blue line) and 200 (red line) day moving averages, the short-term action is somewhat encouraging.
While the inverted H&S formation requires further work, both investors/traders may want to utilize the following levels as a guide in order to garner further clues/evidence with respect to direction.
If, at any point in the days ahead, BTC can go top-side of the 7730 figure and ‘stick’ and perhaps more importantly, clear the 8020 level, such development/s, should they materialize, would certainly be a welcome relief and begin to repair some of the recent technical damage despite still trading below both its 50 and 200DMA’s.
On the flip-side, if BTC is unable to overcome the 7730 level and ‘stick’ and subsequently ‘takes-out’ the 7260 level at any time in the days/weeks ahead, such would likely suggest that the potential inverted H&S formation would once again be a failure and would also more than likely precipitate additional selling pressure.
Thus, while the recent short-term action is encouraging as well as providing some much-needed relief, further work remains before we can declare that BTC is out of the woods and in the clear.
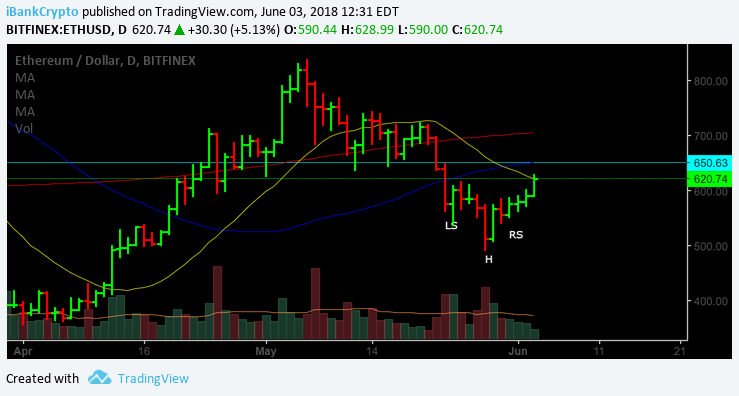
Moving on to Ethereum (ETH), we can see from the Chart below that, much like BTC, Ethereum is also forming a potential mini inverted H&S formation and attempting to move up-and-out.
While Ethereum also finds itself trading below both its 50 and 200DMA’s, representing a poor technical posture as we can observe above, ETH is not nearly as far beneath its moving averages as that of BTC.
Moving forward, if, at any time in the days ahead, ETH is capable of clearing the hurdle located at the 650 level and can ‘stick’, which coincidentally is where we find the 50-day moving average, such development, should it occur, would certainly be a positive development. On the other side of the ledger, should ETH breach the 538 figure, such occurrence would likely render the inverted H&S formation null-and-void.
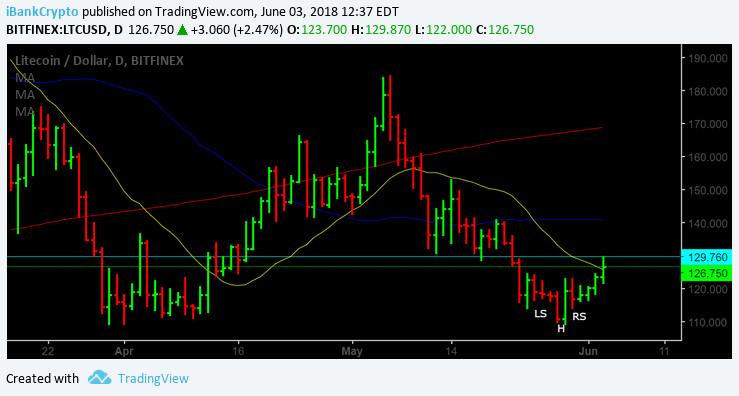
Looking at the Chart of Litecoin (LTC) below, much like both BTC as well as ETH, Litecoin finds itself in a similar position attempting to move up-and-out of its mini potential inverted H&S formation as well as trading well below both its 50 and 200-day moving averages.
When viewing the action of LTC above, it’s apparent that it finds itself in a similar technical posture as that of both BTC and ETH.
Thus, moving forward, both investors/traders may want to monitor the following levels for additional clues/evidence with regards to direction.
If, at any point in the days ahead, LTC is capable of going top-side of the 129.30 level and perhaps more importantly, the 141 figure, such development, should it occur, would surely be a positive step for LTC. Whereas, if LTC should happen to breach the 114.25 level at any time in the days ahead, such development, should it occur, would suggest that its potential inverted H&S formation would be a failure.
Last, but certainly not least, we take a look at Bitcoin Cash below, as BCH may just find itself in a better position presently than the aforementioned above.
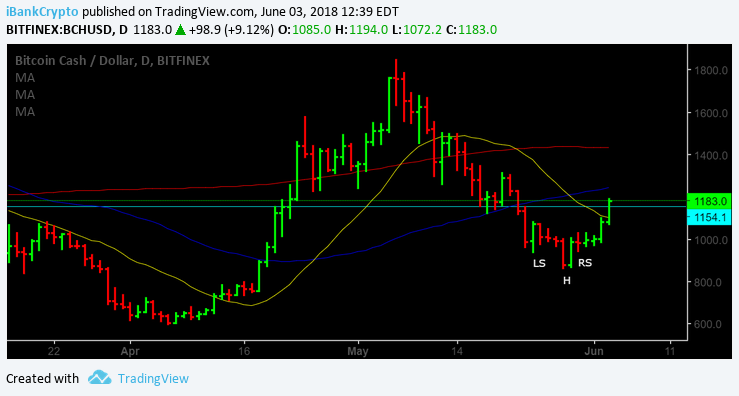
As we can observe from the action above, BCH, like BTC; ETH and LTC also find itself in the process of forming its very own potential inverted H&S formation.
However, unlike BTC; ETH as well as LTC, which have yet to clear their respective initial hurdles and ‘stick’ – thus far, BCH has indeed cleared and is holding its initial hurdle located at the 1153 level.
Moving forward, if BCH can continue to hold the 1153 figure and perhaps of more importance, can clear its 50DMA, presently located at the 1244 level, such would certainly go a long way in repairing some of the short-term technical damage that has been inflicted over the past several weeks. On the flip-side of the coin, should BCH lose the 941 level at any point in the days ahead, such would more than likely suggest that lower prices are in the offing.
Thus, of the four names we’ve focused on in this report, BCH presently finds itself leading the way, while BTC; ETH as well as LTC have further work in order to complete their potential inverted head-and-shoulders formations.
While the present overall climate finds itself reaping some welcome short-term relief in the absence of storm clouds, as we have suspected, further work remains before we can declare the coast is clear.
Happy Trading!!
For the latest cryptocurrency news, join our Telegram!
Disclaimer: This article should not be taken as, and is not intended to provide, investment advice. Global Coin Report and/or its affiliates, employees, writers, and subcontractors are cryptocurrency investors and from time to time may or may not have holdings in some of the coins or tokens they cover. Please conduct your own thorough research before investing in any cryptocurrency and read our full disclaimer.
Image courtesy of Pexels
Charts courtesy of tradingview.com
The post Bitcoin (BTC) Ethereum (ETH) Litecoin (LTC) Bitcoin Cash (BCH) Technical Analysis – Relief At Last appeared first on Global Coin Report.

Globalcoinreport.com/ is author of this content, TheBitcoinNews.com is is not responsible for the content of external sites.
Our Social Networks: Facebook Instagram Pinterest Reddit Telegram Twitter Youtube


