Crash mode is in effect once again for the cryptocurrency complex, as a number of large market cap coins emptied out their guts again last night, sliding lower by big chunks.
As we take a close look at the charts of XRP price and Stellar (XLM) price, it’s important to focus an unemotional and clear view on the raw technicals to find an edge as far as tone and levels looking forward.
XRP
Price Analysis
- High: $0.27671
- Low: $0.24706
- 24-Hour Volume: $278.67M
- 7-day Percent Change: -36.8%

XRP price has taken a beating. Plain and simple. There are no two ways about it. It has been an awful beating at that.
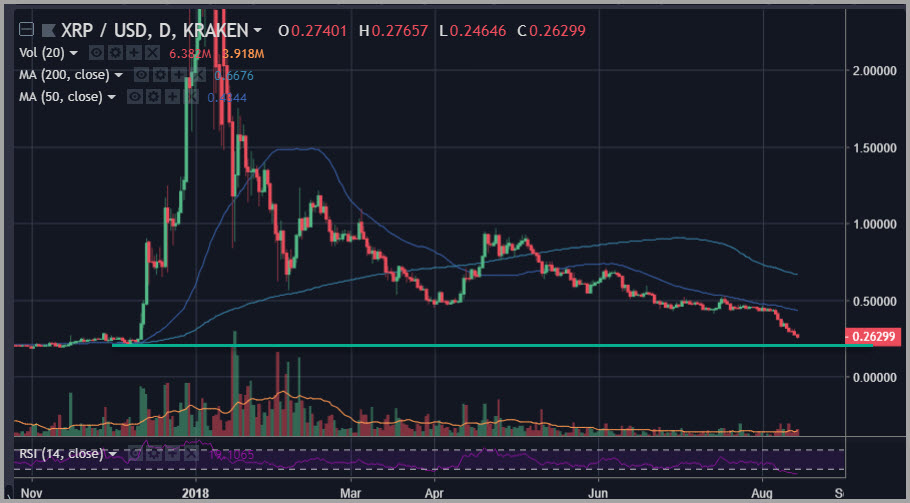
XRP price has fallen nearly 50% over the past month, shattering a key support level at the $0.43 zone and then accelerating lower in a waterfall decline that has outpaced most other large coins over the same period in terms of pure downside action.
At this point, the coin is still sporting the bare minimum as far as a bullish hourly MACD divergence. At the same time, support at the $0.28 level has been busted up pretty badly, opening the trapdoor to test the $0.25 level.
As we noted in our analysis earlier this week, the ultimate support here for XRP may possibly be found at the $0.20 level. In addition, traders should note that the 14-day RSI measure is now printing new all-time record lows, which may support a near-term bounce.
Stellar (XLM)
Price Analysis
- High: $0.22276
- Low: $0.19586
- 24-Hour Volume: $112.46M
- 7-day Percent Change: -11.38%

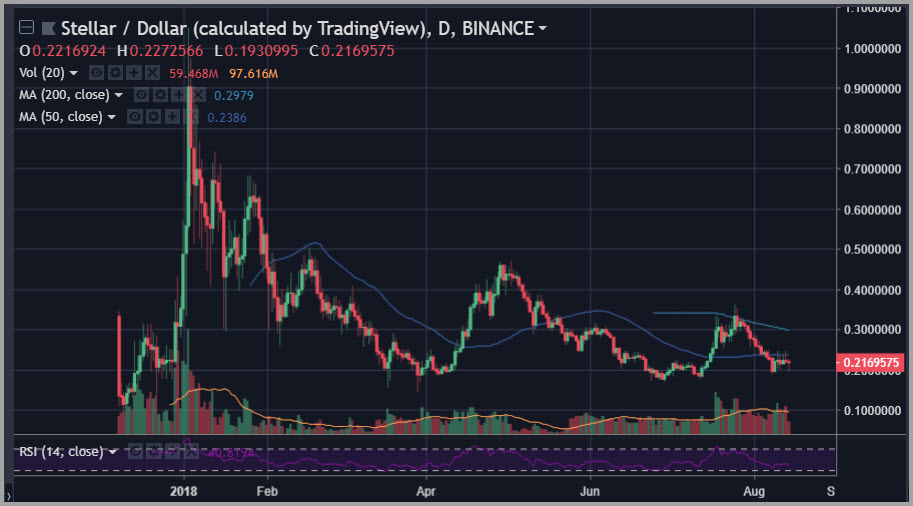
Unlike XRP, Stellar (XLM) has been managing to hold well above both its late June lows and late March lows. In other words, Stellar (XLM) has been a clear relative outperformer.
That said, we are also seeing selling here.
Everything is relative when you start to talk about asset class-wide analytics from a technical perspective. In this case, we tend to compare the large market cap coins against one another, and against Bitcoin. For Stellar (XLM), we have a clear case of relative strength that has been in place throughout the summer.
While we broke below the 50-day moving average, we haven’t broken under the bullish pivot formed in late June, which has been a clear reference point for many large-cap coins.
Our current read here is relatively promising given the devastation that we have seen across the complex.
However, one must admit that the larger time frame chart for Stellar (XLM) does appear to be a bearish descending triangle. In other words, bottom picking here – while supported by relative strength metrics – may not be for the faint of heart.
Happy Trading~
To trade cryptocurrencies, sign up with Binance!
Disclaimer: This article should not be taken as, and is not intended to provide, investment advice. Global Coin Report and/or its affiliates, employees, writers, and subcontractors are cryptocurrency investors and from time to time may or may not have holdings in some of the coins or tokens they cover. Please conduct your own thorough research before investing in any cryptocurrency and read our full disclaimer.
Image courtesy of Pexels
Charts courtesy of tradingview.com
The post XRP Price Stellar (XLM) Price: Busted, but What’s Next? appeared first on Global Coin Report.
Read more at https://globalcoinreport.com/xrp-price-stellar-xlm-price-busted-but-whats-next/

Globalcoinreport.com/ is author of this content, TheBitcoinNews.com is is not responsible for the content of external sites.
Our Social Networks: Facebook Instagram Pinterest Reddit Telegram Twitter Youtube


