Bitcoin has surged $1,000 from last week’s lows of $10,400. At $11,400, the cryptocurrency remains decisively higher than it was before this rally. Even still, analysts think that Bitcoin is primed to undergo a reversal as its short-term to medium-term chart flashes a number of warning signs.
Bitcoin Could Face a Short-Term Pullback as Price Fails to Pass Breaker
One crypto-asset analyst recently shared this chart below. It shows that BTC’s recent rally ended right at a key “daily breaker level,” suggesting that the coin is “good for a pullback” in the days ahead.
As to what exactly he expects to happen, he thinks that Bitcoin will range between $11,700 and $10,700 for the foreseeable future, as that’s where crucial technical levels lie.
Commenting on the specifics of the chart, the analyst who shared it wrote:
“Price tagged bearish daily breaker confluent with EQ As good as price looks for a pullback Id say we range between these levels a bit longer to properly distribute Poor highs around Monday’s high so areas for dips are the H6 breaker and shorts on a sweep.”
Chart of BTC's price action over the past 12 months with analysis by crypto  trader Rekt Proof (@RektProof on Twitter).
Source: BTCUSD from TradingView.com
Bitcoin could slide towards $11,100 in the days ahead as it faces a CME futures gap at that level. 75% of CME BTC futures gaps fill within the week they open.
Macro Trend Still Favoring Bulls
The macro trend still favors bulls despite Bitcoin’s short-term weakness and potential for downside.
Tyler Winklevoss, a co-founder of Gemini, recently said that any push for further inflation of the U.S. dollar and fiat currencies will prove Bitcoin’s value:
“Stonks love nothing more than wen the money printer goes brrrr like an A-10 warthog. It’s full-fledged addiction that’s not going to end until it has to. When that will happen is hard to predict, but what’s certain is that #Bitcoin will b your only refuge.”
Technical trends favor bulls as well.
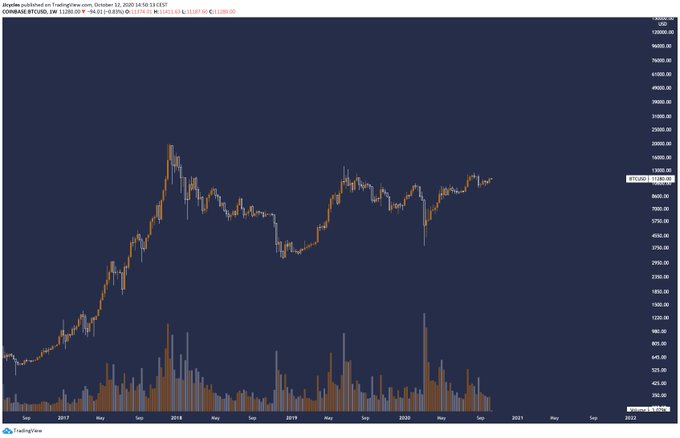
One crypto-asset analyst recently pointed to three key reasons why the macro trend for Bitcoin is still favoring long-term growth. These include Bitcoin flipping a macro $10,000 range into support, BTC breaking above a critical long-term trendline, and BTC retracing to a golden pocket Fibonacci Retracement on a macro time frame.
Chart of BTC's weekly chart since the middle of 2016 with analysis by crypto trader JJCycles (@jjcycles on Twitter).
Source: BTCUSD from TradingView.com
Photo by Paweł Czerwiński on Unsplash
Price tags: xbtusd, btcusd, btcusdt
Charts from TradingView.com
Bitcoin "Looks Good" For a Pullback as Price Fails to Pass Key Level

Bitcoinist.com is author of this content, TheBitcoinNews.com is is not responsible for the content of external sites.
Our Social Networks: Facebook Instagram Pinterest Reddit Telegram Twitter Youtube


