- Bitcoin has consolidated between $11,000-12,000 over recent weeks.
- While the consolidation has only lasted for just over two weeks, prices are tightening again.
- By indicators like the width of the Bollinger Bands, volatility is reaching notable lows yet again.
- This signals to analysts that a massive Bitcoin price move is likely imminent.
- Fortunately for bulls, there are many analysts expecting upside due to both technical and fundamental trends.
- How high Bitcoin rallies in this potential breakout, though, is not yet clear.
Bitcoin Could Soon See a Massive Move: Volatility Indicators
While Bitcoin is whipsawing between $11,000 and $12,000, volatility is actually low by historical standards.
Brave New Coin crypto analyst Josh Olszewicz shared the chart below on August 15th, showing that the Bollinger Bands are tightening. The Bands are a classic technical indicator used by traders to denote volatility and important price levels.
The Bands are not extremely tight per se, but it’s a notable shift from where they were just a week or two ago.
Chart of BTC's price action over the past year with the Bollinger Bands indicator by trader Josh Olszewicz (@CarpeNoctum on Twitter). Chart from Tradingview.com
Olszewicz proceeded to share another chart, which shows that the Bollinger Bands are at lows historically seen prior to volatility. For instance, a time the Bollinger Bands were this skinny was February 2020, prior to the March plunge.
The seeming imminence of another large Bitcoin moves raises the question of which way BTC will move.
According to a number of analysts, a surge to the upside is more likely than a return to the $10,000s or $9,000s.
Upside Is More Likely Than Downside
As reported by Bitcoinist previously, crypto fund manager Charles Edwards sees few reasons to be bearish on Bitcoin right now. In a tweet that went viral within crypto circles, Edwards identified a number of trends that indicate bullish strength is building. These include Dave Portnoy investing in Bitcoin, gold rallying, Tether’s market cap increasing, and the hash rate of BTC increasing.
How can you be bearish Bitcoin here?
– Portnoy in Bitcoin
– Fed investigating crypto dollar w MIT
– Gold S/R flip
– +26% Tether
– 45% supply hasn’t moved in >2yrs
– Energy Value increasing > price
– Mining profitable & price near Production Cost
– Accumulation price structure— Charles Edwards (@caprioleio) August 13, 2020
Analysts are also optimistic for technical reasons. Olszewicz, the analyst who shared the volatility analyst mentioned above, noted that he currently has a bullish bias. This bias is due to BTC currently holding above the 20-day simple moving average.
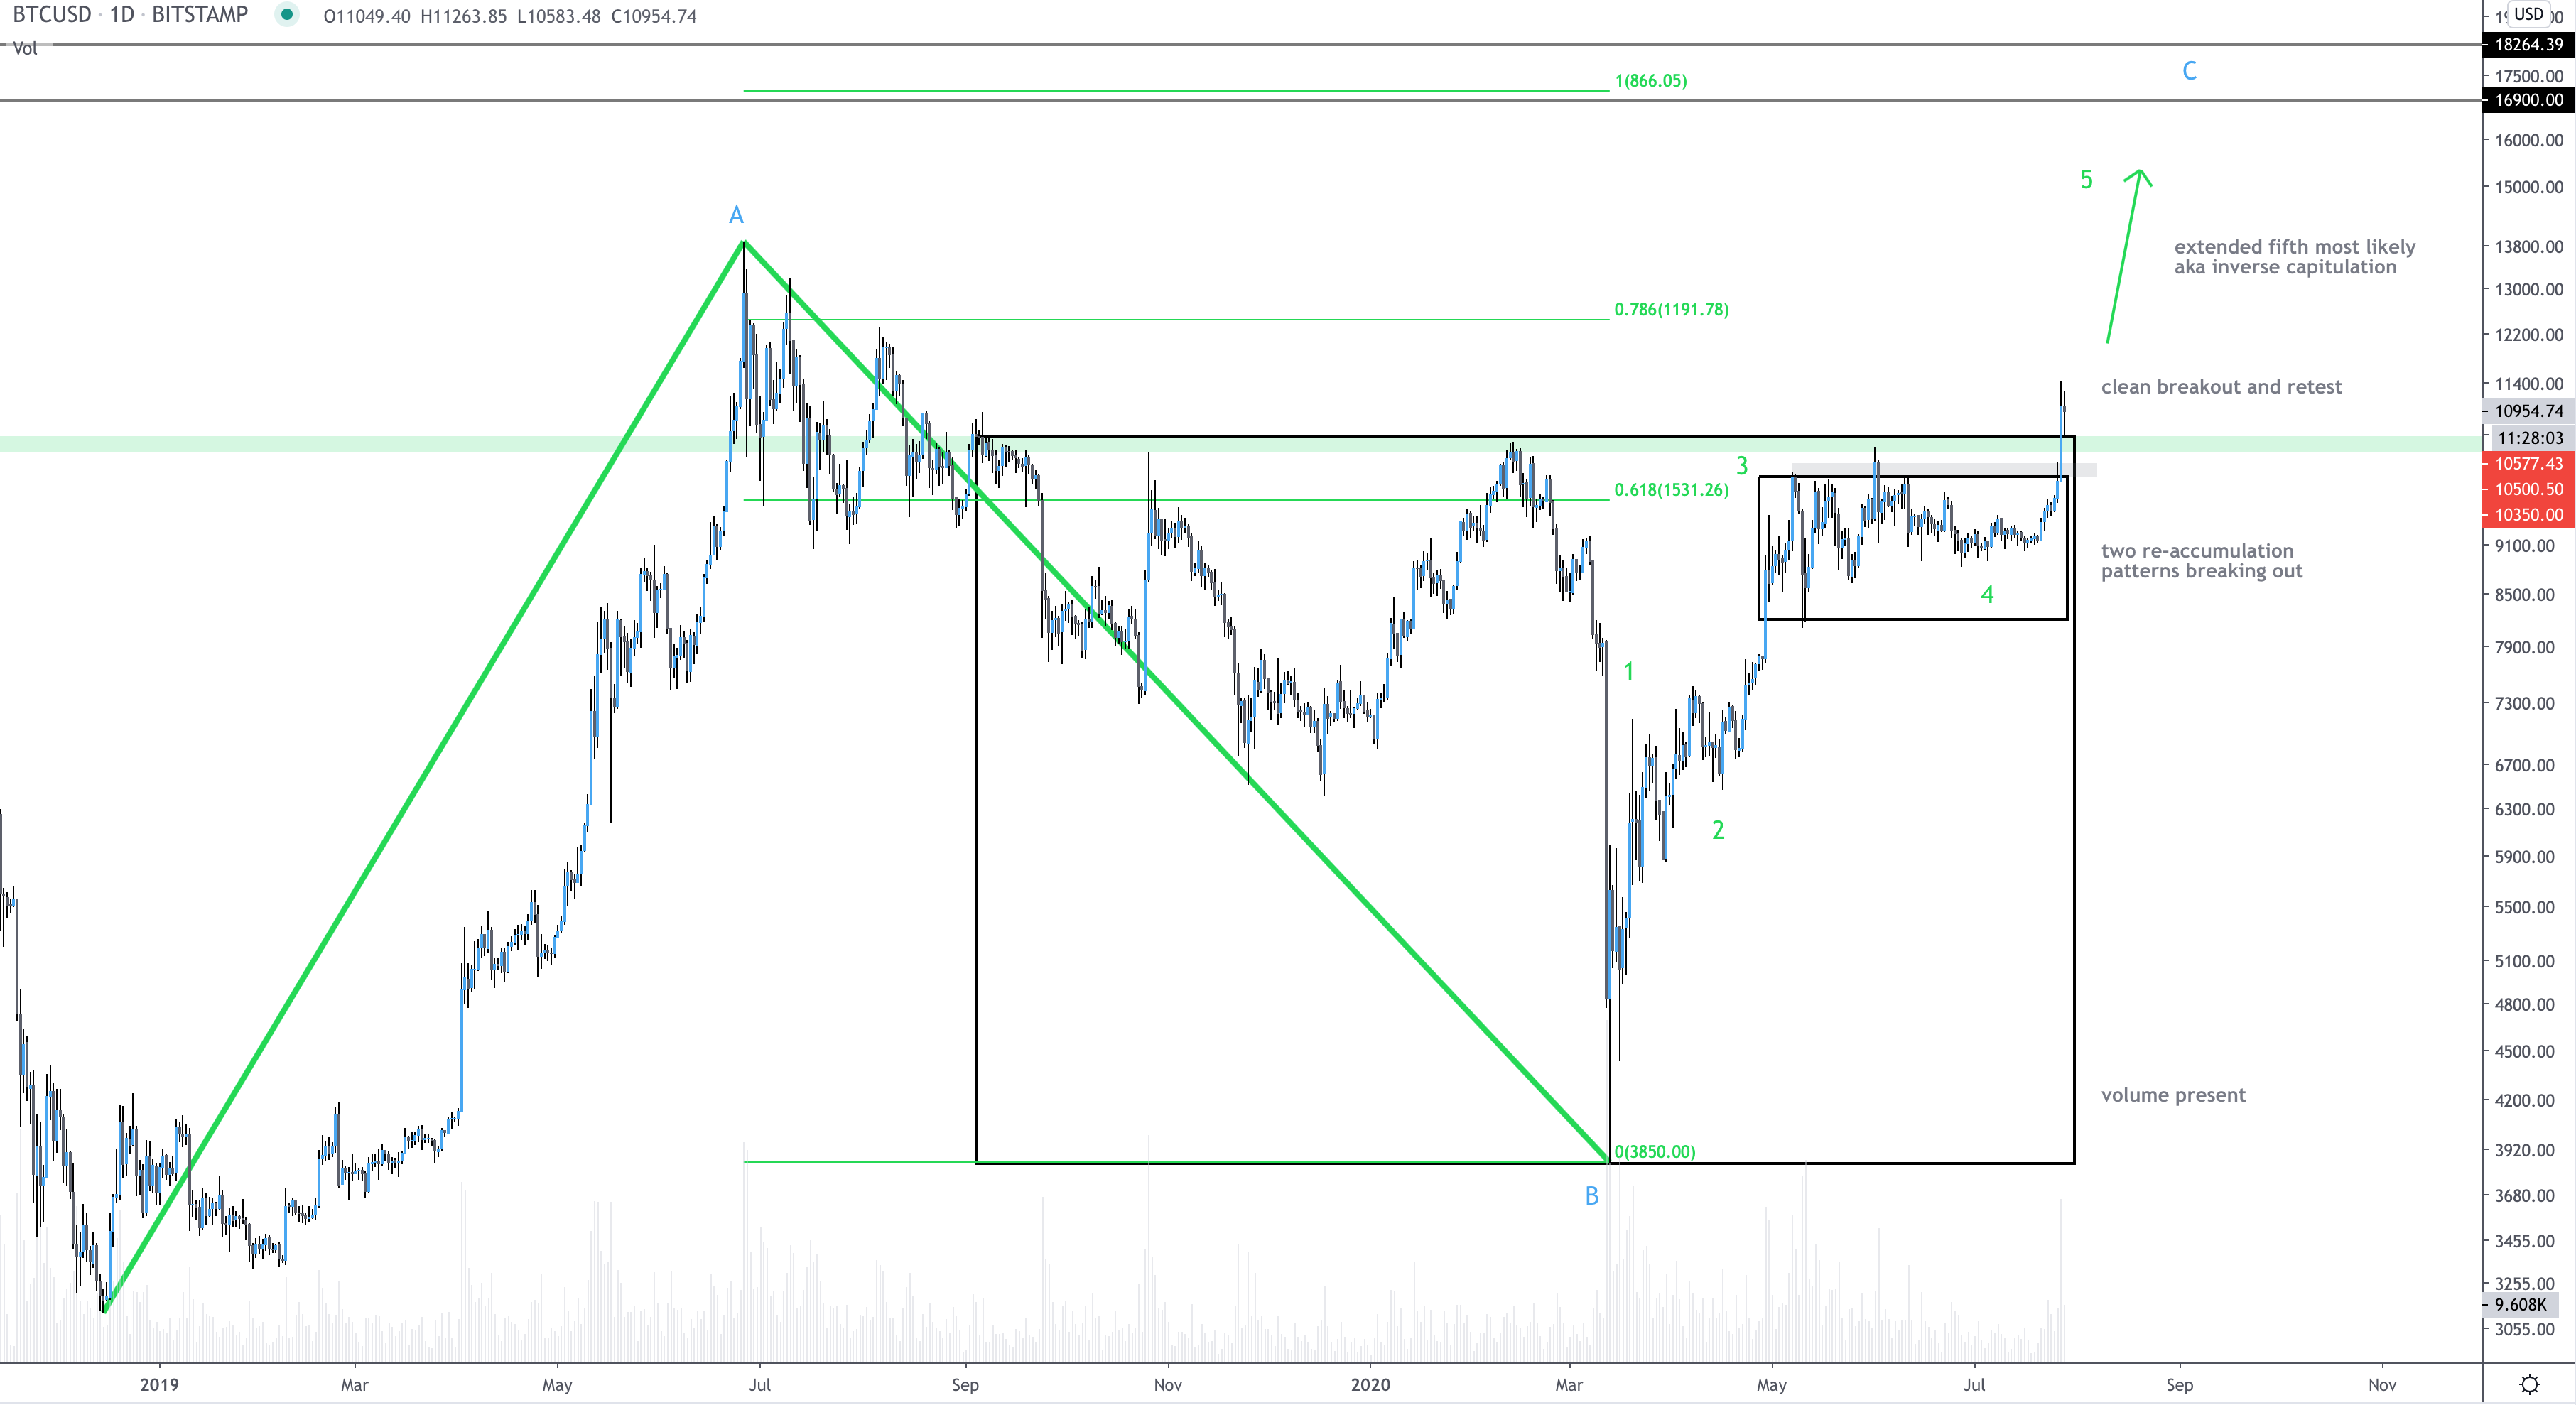
The analyst who predicted Bitcoin would see a V-shaped reversal at the March lows also shared the chart below at the end of July. It suggests that Bitcoin has room to move to the upside:
“$BTC giving the cleanest breakout-retest setup I have seen in a very long time whilst each corrective wave since 4K has been vertical re-accumulation This has all characteristics for a strongly extended fifth – aside from BTC generally loving extended fifths.”
BTC price analysis by Ethereum Jack (@BTC_JackSparrow on Twitter). Chart from TradingView.com
A dynamic these investors should keep an eye on, though, is movements in the precious metals and equities markets. A correction in these markets could drag BTC lower.
Photo by Jamison McAndie on Unsplash
Price tags: xbtusd, btcusd, btcusdt
Charts from TradingView.com
A Massive Bitcoin Price Move Is Likely Imminent... Again: Here's Why

Bitcoinist.com is author of this content, TheBitcoinNews.com is is not responsible for the content of external sites.
Our Social Networks: Facebook Instagram Pinterest Reddit Telegram Twitter Youtube


