


Bitcoin (BTC) is travelling below immediate resistance $6,400 (68.2% Fibonacci).
Bitcoin Cash (BCH) price fell below $700 and continues to sport a bearish trend.
Bitcoin (BTC/USD)
Price Analysis
- High: $6345.3 USD
- Low: $6286.3 USD
- Major Resistance Level: $6400
- Hourly MACD: Placed slightly in the Sell zone.
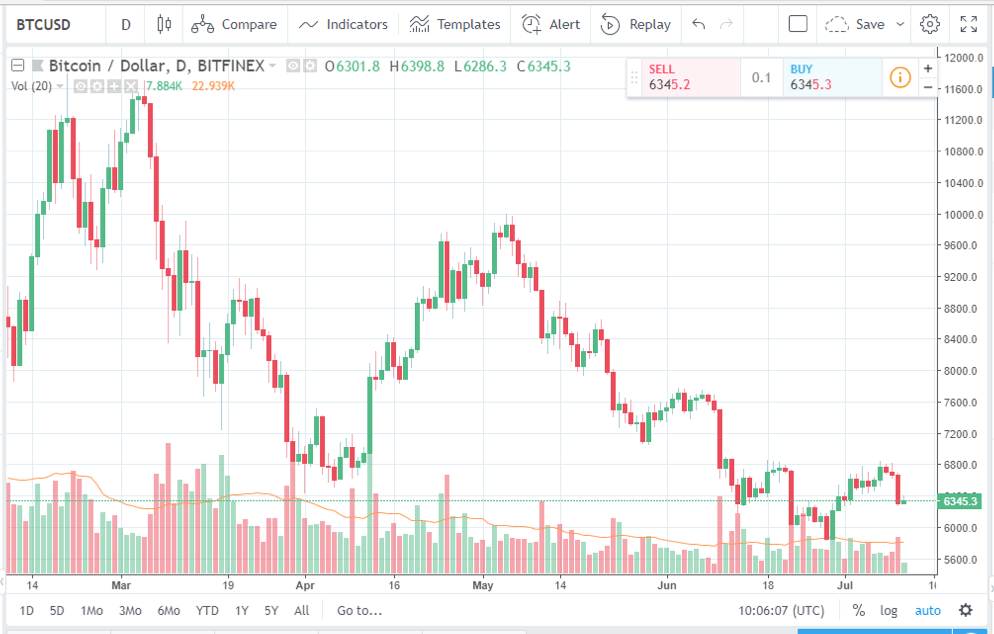
At the time of writing, Bitcoin (BTC) had already dropped well below the $6400 USD level to $6345.3 USD and the market sentiment is largely bearish. (As of 11th July 2018) The price action of BTC/USD pair, as observed from the chart, shows that it had started falling after a slight upward movement over the weekend, and had dropped yesterday from nearly $6696.06 to almost $6307.64. Comparatively, the cryptocurrency is trying to recover a little bit today with approximately 0.69% (24h) rise at the time of writing.
The price of Bitcoin had dipped below $6000 level by the end of June but, the bulls had taken over at the beginning of July. This had given a little hope to the investors. As can be seen on the chart, it was quite close to the $6800 level but the price movement had trespassed the support areas at $6600 and $6400. Even though the declines seem to have paused above the 50% Fibonacci retracement, there seems to be another rising wedge pattern that may end in more declines in the medium-term.
Bitcoin Cash (BCH/USD)
Price Analysis
- High: $688.2 USD
- Low: $84.7 USD
- Major Resistance Level: $735
- Hourly MACD: Very slowly moving towards the Bullish zone.
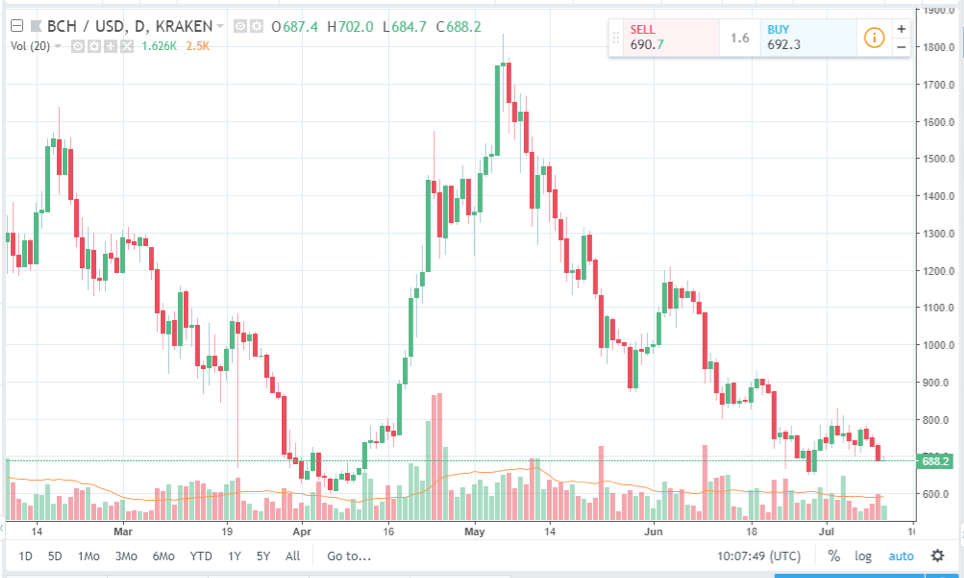
The price of BCH/USD pair is experiencing a major bearish trend and has gone beyond the $700 level. Even if the pair corrects in the short-term it is still unsure whether the price will move to create a major uptrend. Yesterday, the Bitcoin Cash market had experienced a sharp downfall in price, from a little above $750 to nearly $684. The price of Bitcoin Cash at the time of writing shows $688.2 USD while the market tries to recover a little, nearly 0.15% (24h) increase. (As of 11th July 2018)
According to the chart, resistances have formed above the $706 level with $710 (previous support) being a key barrier at the moment. Chances are there that the price of the BCH/USD pair can move beyond the $710 level. The major resistance is formed at the $735 level based on the hourly chart and the same trend line is quite close to the 50% Fibonacci retracement level. As the 100 hourly SMA is positioned near resistance line $735, if the price moves uptrend and reaches the level then it is more likely to face some challenges. The upside is that if the price steadies itself above the $710 level there is a chance of formation of a stronger uptrend. It is also to be seen how the news of the upcoming Bitcoin Cash hard fork in November 2018 (released today) will affect the market.
The Fibonacci retracement levels for both Bitcoin and Bitcoin Cash at the moment shows there is still a chance of recovery for the crypto coins and move into the bullish zone.
Happy Trading!!
For the latest cryptocurrency news, join our Telegram!
Disclaimer: This article should not be taken as, and is not intended to provide, investment advice. Global Coin Report and/or its affiliates, employees, writers, and subcontractors are cryptocurrency investors and from time to time may or may not have holdings in some of the coins or tokens they cover. Please conduct your own thorough research before investing in any cryptocurrency and read our full disclaimer.
Image courtesy of Pexels
Charts courtesy of tradingview.com
The post Bitcoin, Bitcoin Cash Price Analysis: What’s Happening? appeared first on Global Coin Report.

Globalcoinreport.com/ is author of this content, TheBitcoinNews.com is is not responsible for the content of external sites.
Our Social Networks: Facebook Instagram Pinterest Reddit Telegram Twitter Youtube


