


For the first time since 2015, the Bitcoin price action has formed a “golden cross” pattern providing yet another signal that BTC is in a bull market. It also broke through the $5,600 price mark, setting a new 2019 high.
Golden Cross: Another Bullish Signal for Bitcoin
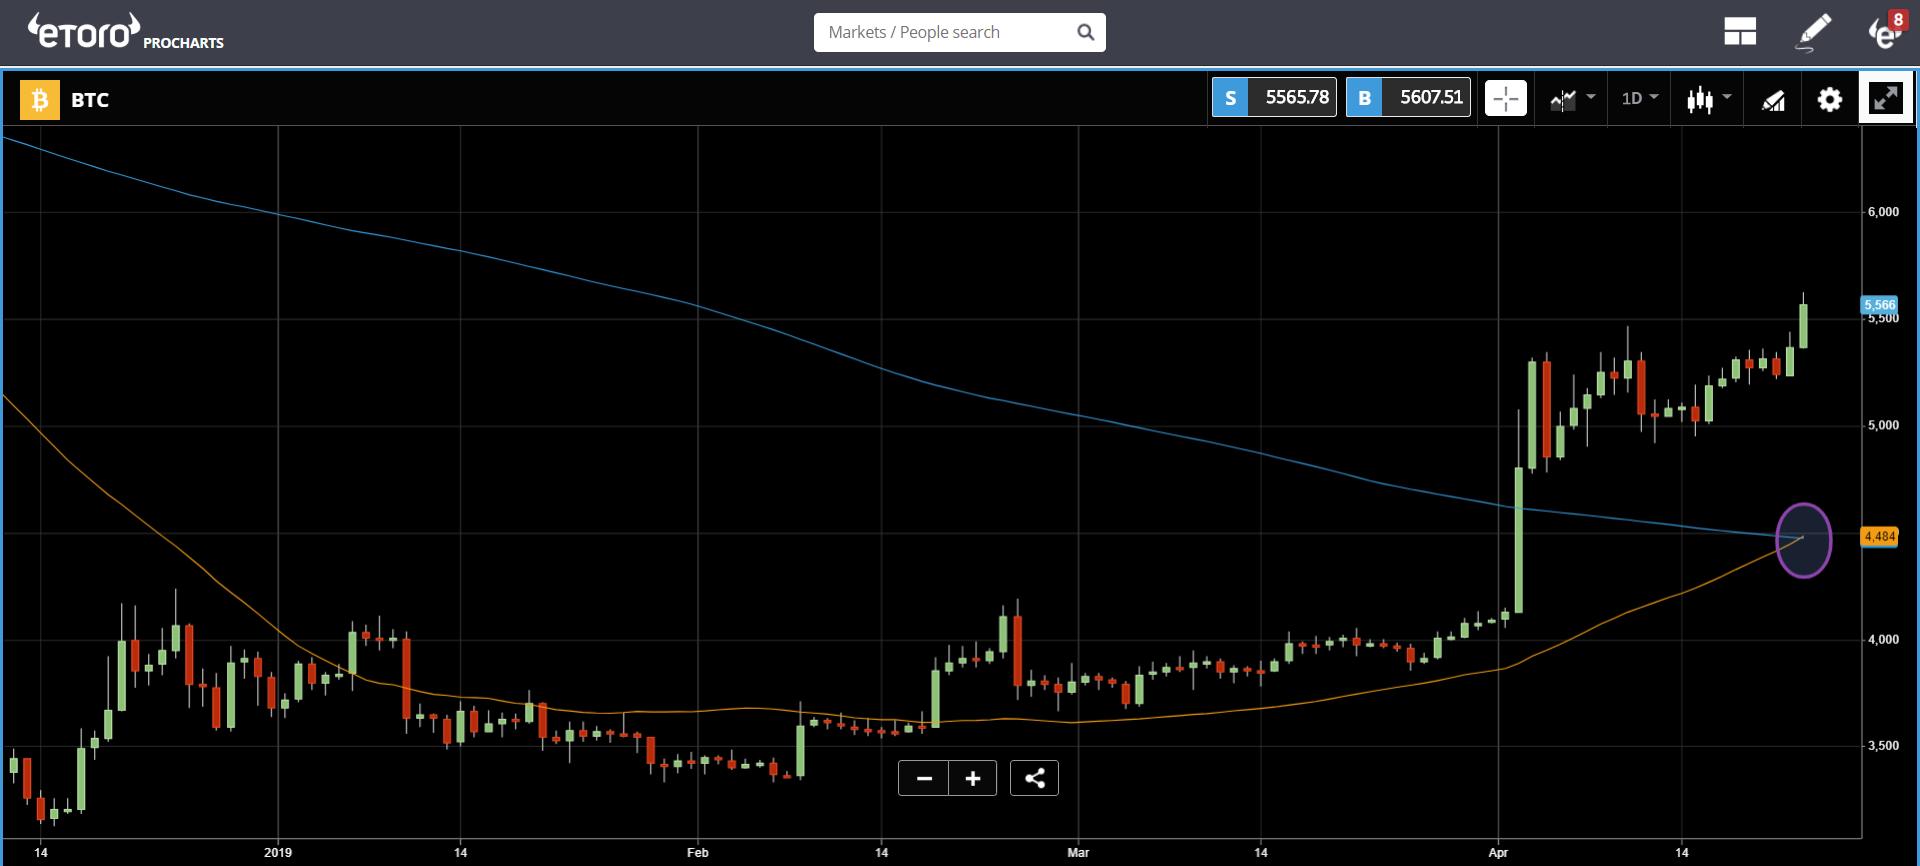
A golden cross chart pattern has formed for Bitcoin with the 50-day moving average (MA) crossing the 200-day MA for BTC to the upside.
Earlier on Tuesday (April 23, 2019), Bitcoinist had indicated that the golden cross pattern for BTC price was imminent. The golden cross, regarded as a “holy grail” pattern provides yet another sign that Bitcoin is entering a new bull market.
Late October 2015 was the last time a golden cross pattern appeared on the Bitcoin price chart. That moment also corresponded to the end of the 2014/2015 bear market phase which would later culminate in the massive bull-run of late 2017.
New Highs for 2019
The appearance of the golden cross comes at the time when Bitcoin has set another 2019 high, this time going beyond $5,600. BTC [coin _price] is up 35 percent in April alone and almost 51 percent since the start of the year.
The formation of the golden cross indicates a BTC uptrend, which corresponds to the second phase of a golden cross formation. A continuation of this uptrend would solidify the argument that Bitcoin has entered a bullish cycle.
Bitcoin bulls will now be looking to see if both the price and the 50-day MA stays above the 200-day MA confirming the bull market argument.
After the last golden cross in October 2015, BTC traded sideways, setting successive higher highs and higher lows. This pattern continued until November of 2017 before it went parabolic hitting nearly $20,000 a matter of weeks.
Bitcoin Back in the Bull Market?
With the price of bitcoin moving further away from the December 2018 low of $3,100, the argument of whether BTC/USD has bottomed out continues to gather steam.

Numerous indicators and experts are beginning to form a consensus that Bitcoin has indeed bottomed out. Analysts like Murad Mahmudov have even flipped their calls from bearish to bullish, agreeing that BTC has most likely set a new long-term bottom.
Each significant uptrend solidifies the interpretation of $3,100 as the BTC long-term bottom price thus creating a more positive market sentiment.
Analysts at Adamant Capital published their findings last week concluding that BTC is currently in an accumulation phase. The researchers add that they expect Bitcoin to trade between $3,000 and $6,500 during this period in the lead up to the next bull-run, which have historically dwarfed previous all-time highs in parabolic fashion.
Do you think the BTC bull run has begun? Let us know your thoughts in the comments below.
Images via Shutterstock, Twitter @MatiGreenspan
The post Bitcoin Forms First ‘Golden Cross’ Since 2015 Price Bottom appeared first on Bitcoinist.com.

Bitcoinist.com is author of this content, TheBitcoinNews.com is is not responsible for the content of external sites.
Our Social Networks: Facebook Instagram Pinterest Reddit Telegram Twitter Youtube


