


- Bitcoin has rallied strongly over the past few weeks.
- The leading cryptocurrency surged from $10,400 to $11,750.
- The coin now trades for $11,400 after a slight correction as buying pressure tapered off.
- Bitcoin is primed to move lower in the near term as it aims to set up another leg to this ongoing rally, analysts say.
- Crypto analysts think this is the case, along with analysts at JP Morgan.
Bitcoin Primed to Move Lower Prior to Rally
Bitcoin is likely to move lower towards $10,700 after the strong $1,000 rally over the past 10 or so days. One crypto-asset trader recently shared the chart below, which shows that the cryptocurrency is consolidating after a strong leg higher.
The analyst thinks that recent price action is setting up for a move toward $10,700, where there is a pivotal moving average, the 0.5 Fibonacci Retracement, and the Point of Control of BTC’s volume profile over the past seven weeks.
Chart of BTC's price action over the past few weeks with analysis by crypto trader Byzantine General (@Byzgeneral on Twitter).
Source: BTCUSD from TradingView.com
Not the Only One That Thinks So
This trader isn’t the only one that thinks Bitcoin is primed to correct. A team of JP Morgan analysts recently stated that the cryptocurrency could move lower as its intrinsic value lags behind the actual market value. The firm derives the intrinsic value of Bitcoin from mining metrics, namely the cost of production:
“The JPMorgan strategists said they calculated an intrinsic value by effectively treating Bitcoin as a commodity and looking at the marginal cost of production.”
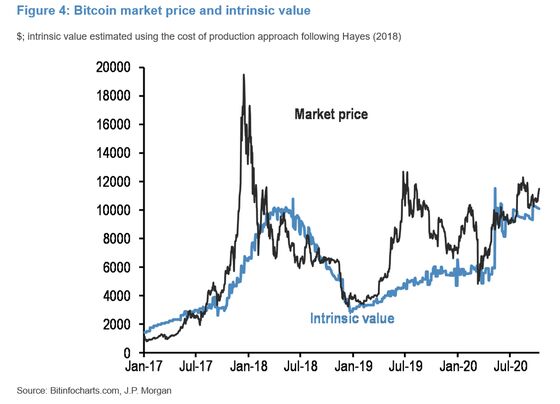
Chart of BTC's price action since the start of 2017 with an instrinsic value analysis by JP Morgan analysts.
Another crypto-asset analyst said that Bitcoin has formed a “sell 9” Tom Demark Sequential candle on its daily chart. This suggests there will be an imminent bearish reversal as “9” candles are often seen when an asset reaches an inflection point in its trend.
That same analyst noted that bearish divergences are forming between the price of Bitcoin on its four-hour chart and the MACD and RSI readings. The RSI and MACD are two crucial technical indicators that show an asset’s trend and trajectory.
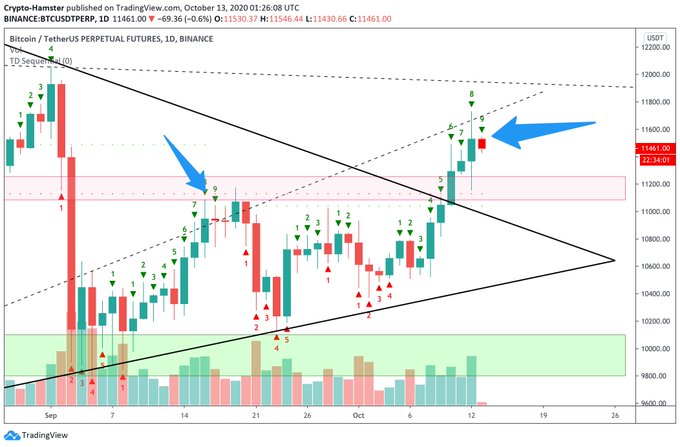
Chart of BTC's price action since the end of August with analysis by crypto trader CryptoHamster (@Cryptohamsterio on Twitter).
Source: BTCUSD from TradingView.com
Photo by Paweł Czerwiński on Unsplash
Price tags: xbtusd, btcusd, btcusdt
Charts from TradingView.com
Bitcoin Is Primed to Correct to $10,700 Before Its Next Leg Higher

Bitcoinist.com is author of this content, TheBitcoinNews.com is is not responsible for the content of external sites.
Our Social Networks: Facebook Instagram Pinterest Reddit Telegram Twitter Youtube


