


Bitcoin sentiment is still very much bullish as price levels increase $2,000 since the beginning of August. On the charts we can now see a bullish pennant has formed which could be foreshadowing an imminent breakout to the next resistance above at $12,400.
Bitcoin Price 1-Hour Analysis
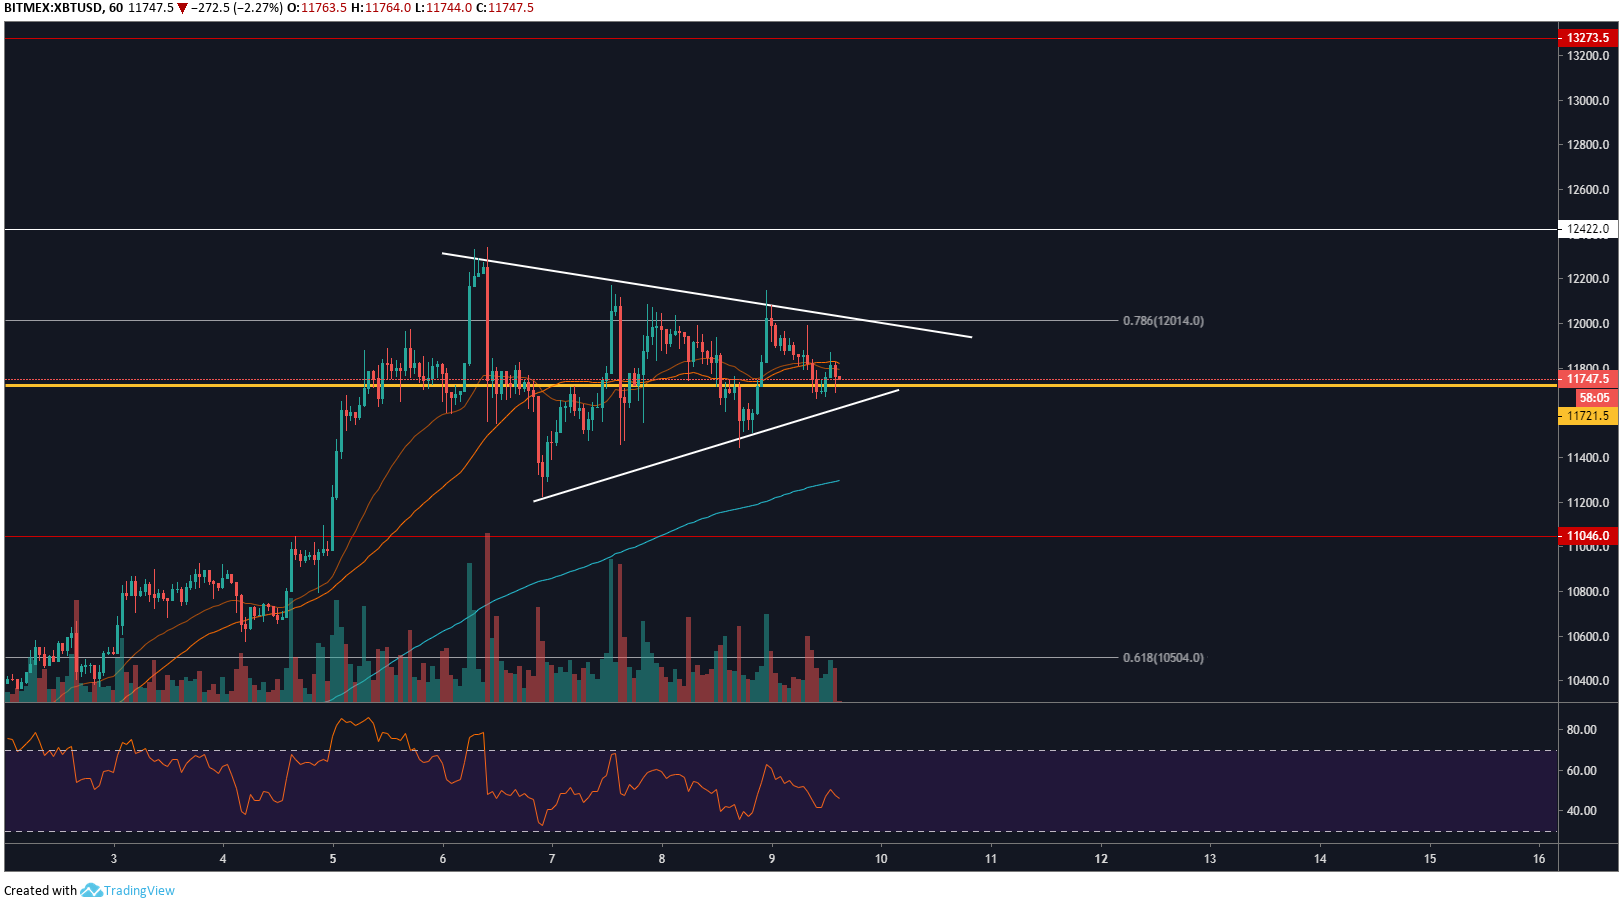
On the 1 hour chart for XBT/USD we can see a bullish symmetrical triangle has formed. This is also known as a bullish pennant and has formed as a result of the recent breakout and move to the upside mentioned in my previous analysis on Bitcoin. RSI has moved down below the median at 50.00 whilst price levels have held strong which shows consolidation is taking place. The $11,700 level, which had been a strong resistance over the last 2 weeks, is now providing solid support.
Descending volume is another characteristic of a bull pennant, not to mention POC (Point of Control) trading directly at market price. This is a very clear indication of consolidation below the key level of $12,400.
If bitcoin price levels do decide to break-down, don’t panic, there’s still a good chance that the $11,000 psychological support should cause price levels to bounce. This effectively shakes out weak hands before a test of the key resistance above at $12,400. 200 EMA also acting as a last chance resort support around $11,250.
4-Hour Analysis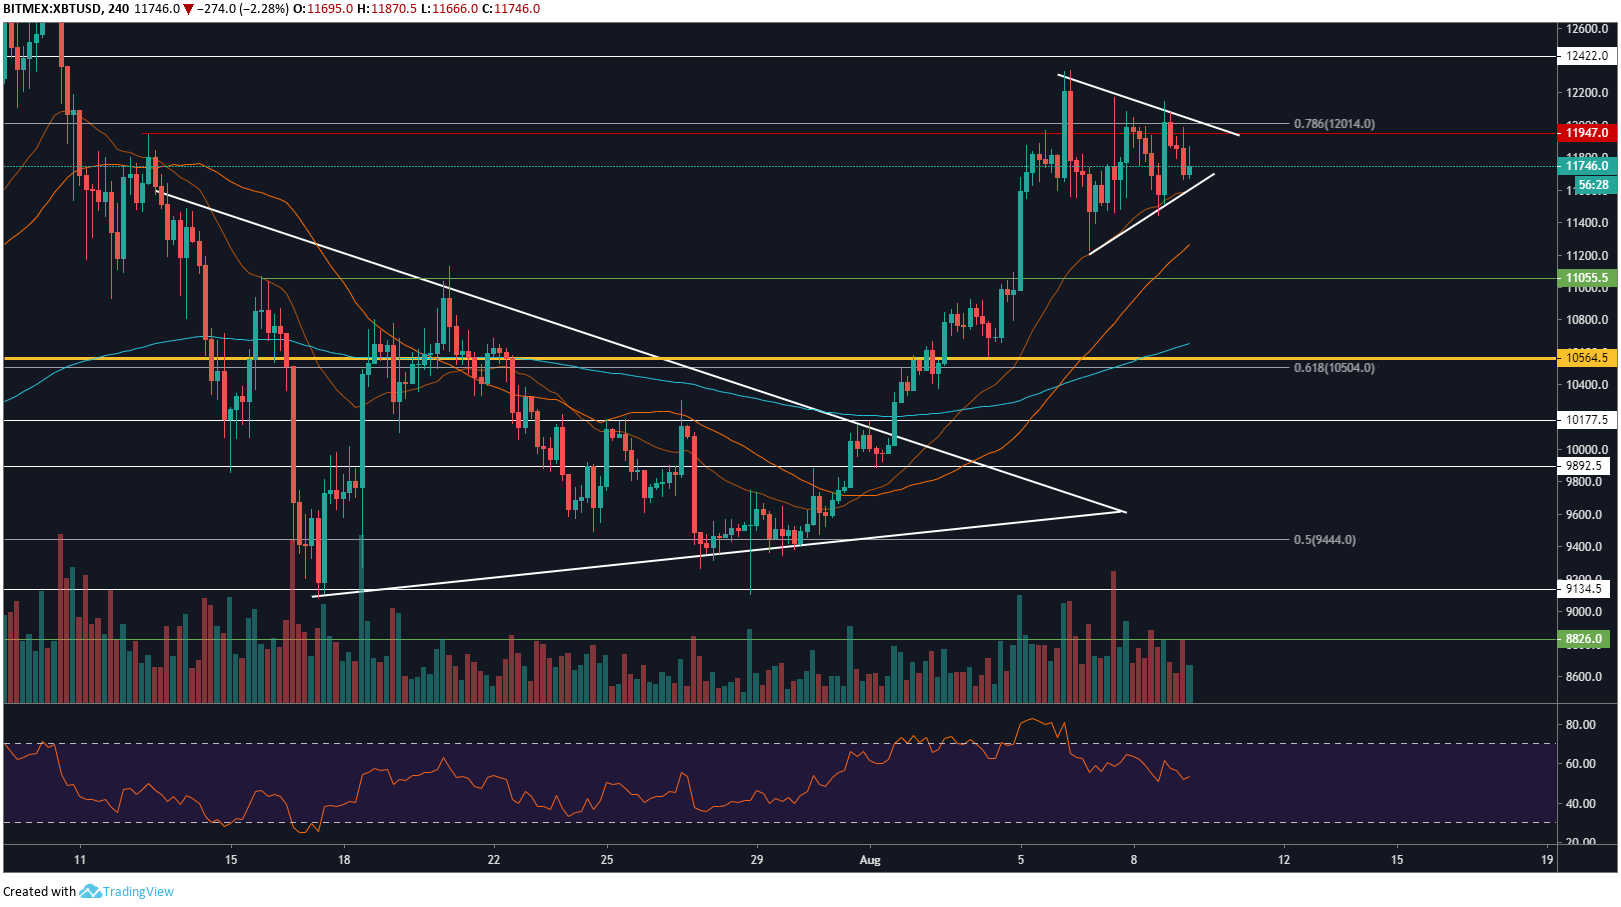
On the 4 hour chart for XBT/USD, we can see a bullish MA cross appeared on August 6 after the 50 MA and 200 EMA bullishly converged. This in conjunction with a sharp up-trend resulting from a clear breakout of the larger asymmetrical triangle, is a clear sign that bitcoin bulls are currently in control.
Volume has started to pick up in the last few days which is really important to note. If volume had remained at the levels seen throughout the end of July and first few days of August, the short-term bullish trend would likely have been unsustainable.
POC sits at a different level to what we can see on the 1 hour chart – right at the 0.618 fib level. This is likely to be the main pull-back target and a level that bullish traders will need to defend if the uptrend is to continue. The RSI will also need to remain above 50.00 on the 4 hour.
Do you think this bull pennant is enough to propel BTC above $12,400 in the coming days? Please leave your thoughts in the comments below!
This article is strictly for educational purposes and should not be construed as financial advice.
Images via Shutterstock, XBT/USD charts by Tradingview
The post Bitcoin Price Analysis: $12.4K in Sight as Bullish Pennant Forms appeared first on Bitcoinist.com.

Bitcoinist.com is author of this content, TheBitcoinNews.com is is not responsible for the content of external sites.
Our Social Networks: Facebook Instagram Pinterest Reddit Telegram Twitter Youtube


