


A much-needed correction has finally arrived to cool off Bitcoin’s month-long parabolic uptrend. This is the first time the leading asset has printed a double digit loss against the US dollar since May 17 – over 40 days ago.
Bitcoin Daily Chart
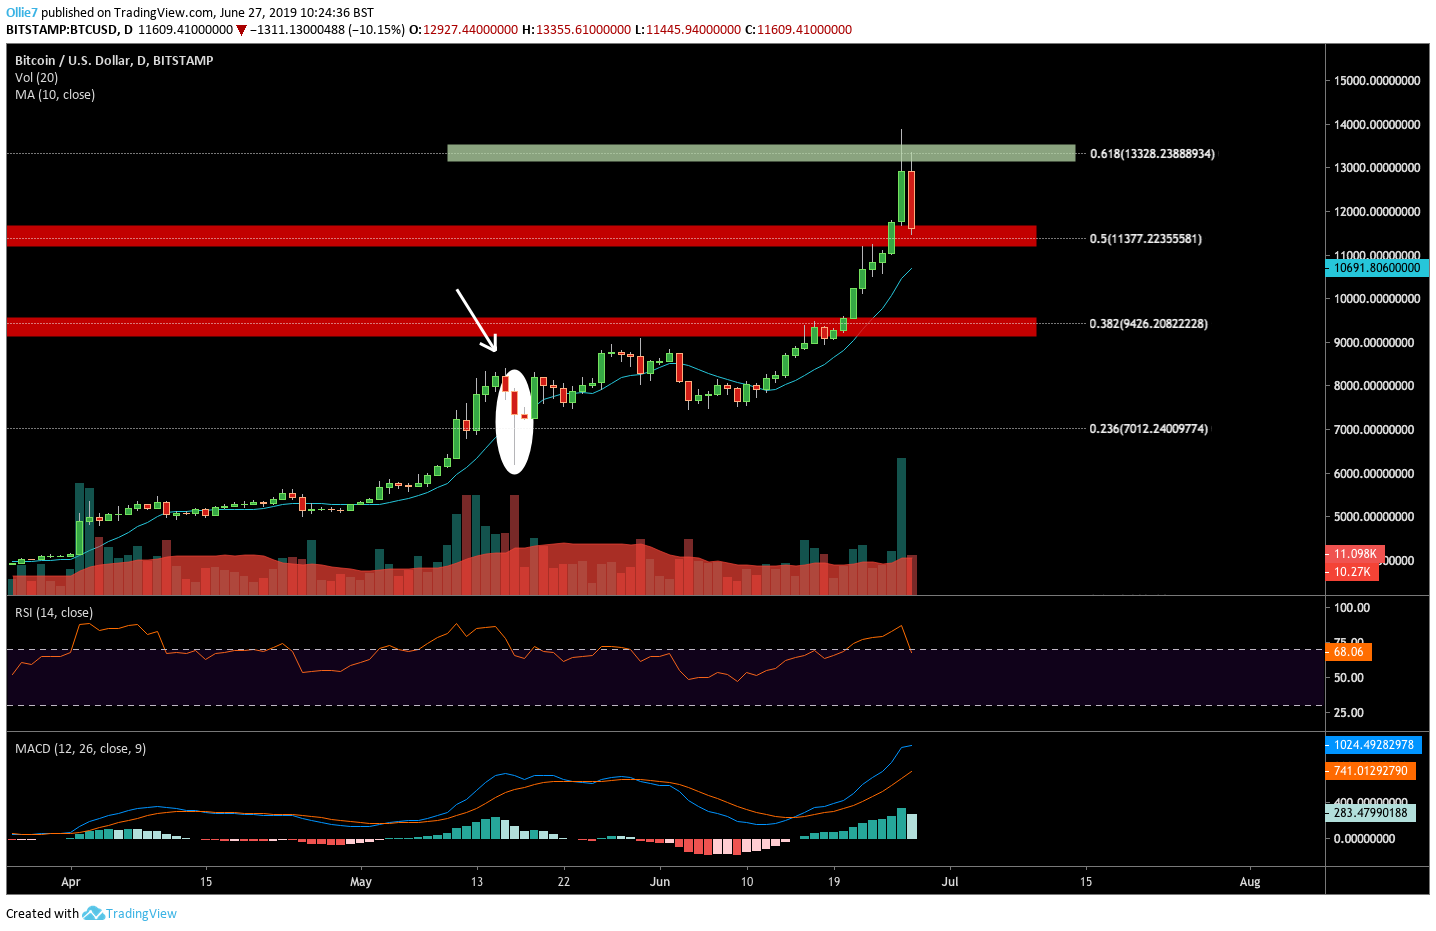
On the 1D BTC/USD chart we can see that bears have now regained control of the over-extended Bitcoin market today, after the asset failed to break above the $13,400 during the American trading session (13:00 PT) yesterday.
The correction has so far driven BTC price 00 down as far as -15%, however bullish traders have already managed to recover over 9% of the opening drop after finding temporary support at the 0.5 fibonacci level below ($11,337).
A sharp decline like this has not appeared on Bitcoin’s chart since the ‘F*** You Reversal’ pattern that played out 41 days ago. But while that pattern turned out to be a bullish reversal signal, this new pullback looks more like a capitulation after a buyers could no longer fuel bitcoin’s vertical climb.
Unsurprisingly, the sell off has triggered buying volume on the MACD histogram to decline. This is the first time we’ve seen volume on the daily chart deviate towards the signal line since June 15 – 12 days ago.
There are some positives to this decline however, that should be noted. The pullback has tipped the RSI back into the index channel from the overbought region, as momentum returns to regular levels. This is a welcomed sign for exhausted bullish traders, and should ease some of the short-term selling pressure weighing down on them. It also creates room for a new uptrend once buyers regain composure.
Bitcoin 1-Hour Chart
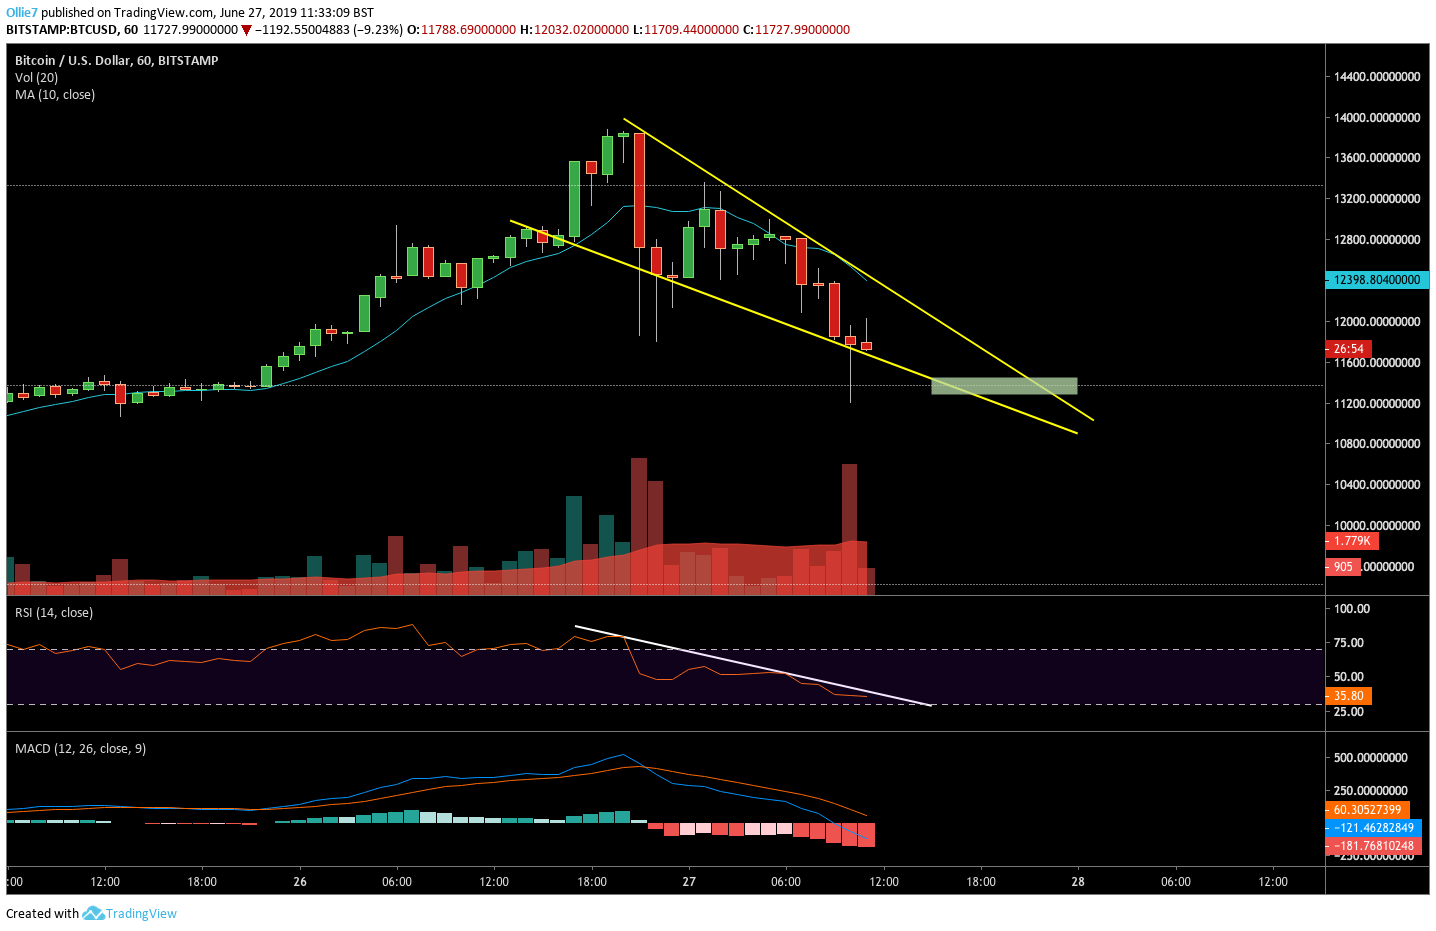
On the 1-hour BTC/USD chart we can see that the price is beginning to consolidate in, what appears to be, a falling wedge pattern. Typically these patterns are bullish reversal patterns, and breaks out once the asset reaches maximum consolidation between the two pinching trend lines.
In order to confirm this, we will need to wait and see if the lower support will hold through the current panic selling period, and drive BTC towards the maximum consolidation point which sits on the 0.5 fibonacci level.
As mentioned in yesterday’s analysis, the fibonacci levels have played pivotal roles in supporting and resisting bitcoin’s movements over the last few months. It’s very possible that once candles retrace back on to this key level, bullish traders will find a strong enough foothold to launch a new upside recovery back towards the 0.786 fibonacci level above.
If it fails however, then we should look to the lower 0.382 fibonacci below at the $9,426 level, as the next most likely major support.
Where do you think Bitcoin is headed over the rest of this week? Let us know your thoughts in the comment section below!
[Disclaimer: The views and opinions of the writer should not be misconstrued as financial advice. For disclosure, the writer holds Bitcoin at the time of writing.]
Images courtesy of Shutterstock, Tradingview
The post Bitcoin Price Analysis: BTC Experiences First Major Pullback in 41 Days appeared first on Bitcoinist.com.

Bitcoinist.com is author of this content, TheBitcoinNews.com is is not responsible for the content of external sites.
Our Social Networks: Facebook Instagram Pinterest Reddit Telegram Twitter Youtube


