


Bitcoin can be seen bouncing off the 0.382 Fibonacci level around $9,600 as price action visibly creates an ascending wedge. Many bearish indicators point towards a break-down and lower low in the coming days.
Bitcoin 1-Hour Analysis
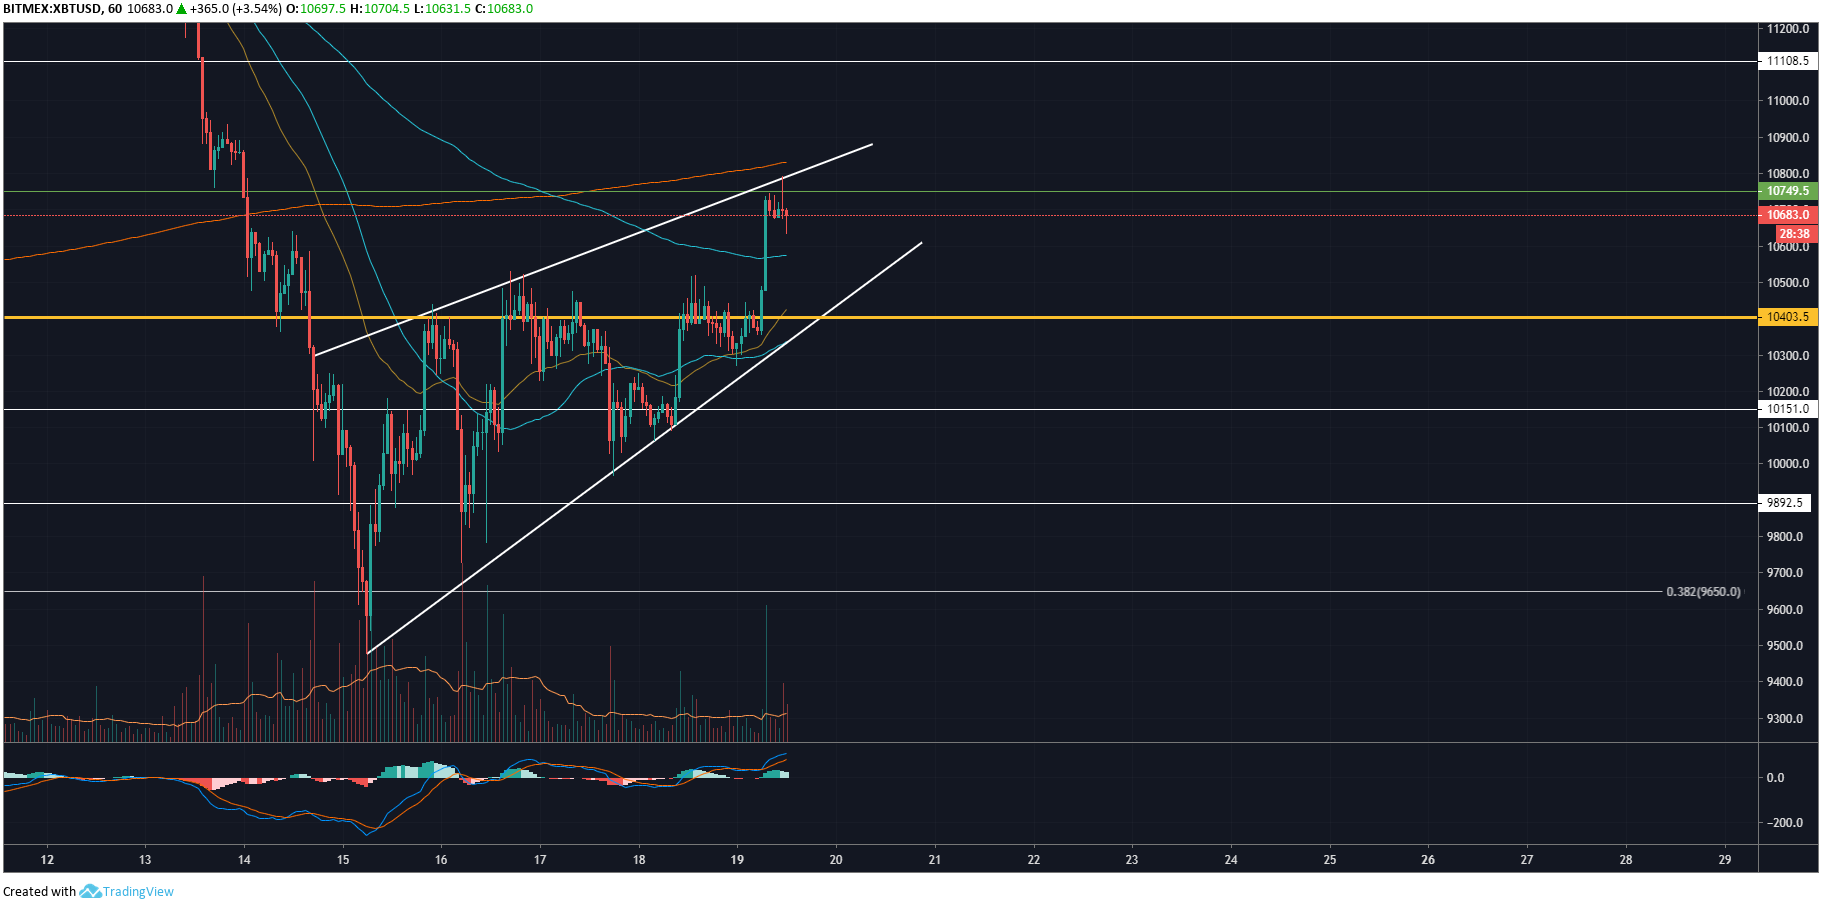
On the 1 hour chart for XBT/USD, we can see an ascending wedge has formed as a result of the bounce off the 0.382 Fibonacci level around $9,600. This trading pattern is inherently bearish, and there’s no reason to challenge that bias here. The ascending wedge now has three higher highs and three higher lows indicating the trading pattern has now been formed, and a break-down will likely happen in the coming hours and days.
Volume is very sporadic at best with buying pressure quickly fizzling out and returning back to stagnant volume predominantly in favour of the bears. POC (Point of Control) at $10,400 acts as short-term support. If this level is broken, we will know that price levels have dropped out of the ascending wedge and will likely re-test the 0.382 Fibonacci level or create a lower low around $8,800, as mentioned in my previous analysis on Bitcoin.
The current Bitcoin market price sits between both the 50 MA and the 200 EMA indicating consolidation which is evident by the ascending wedge. Price levels have now returned to both their 50 and 200-day averages, which is usually an indication of a large move ahead as typically coins will dump/pump, return back to their 50 and 200-day averages, and then repeat the cycle.
4-Hour Analysis
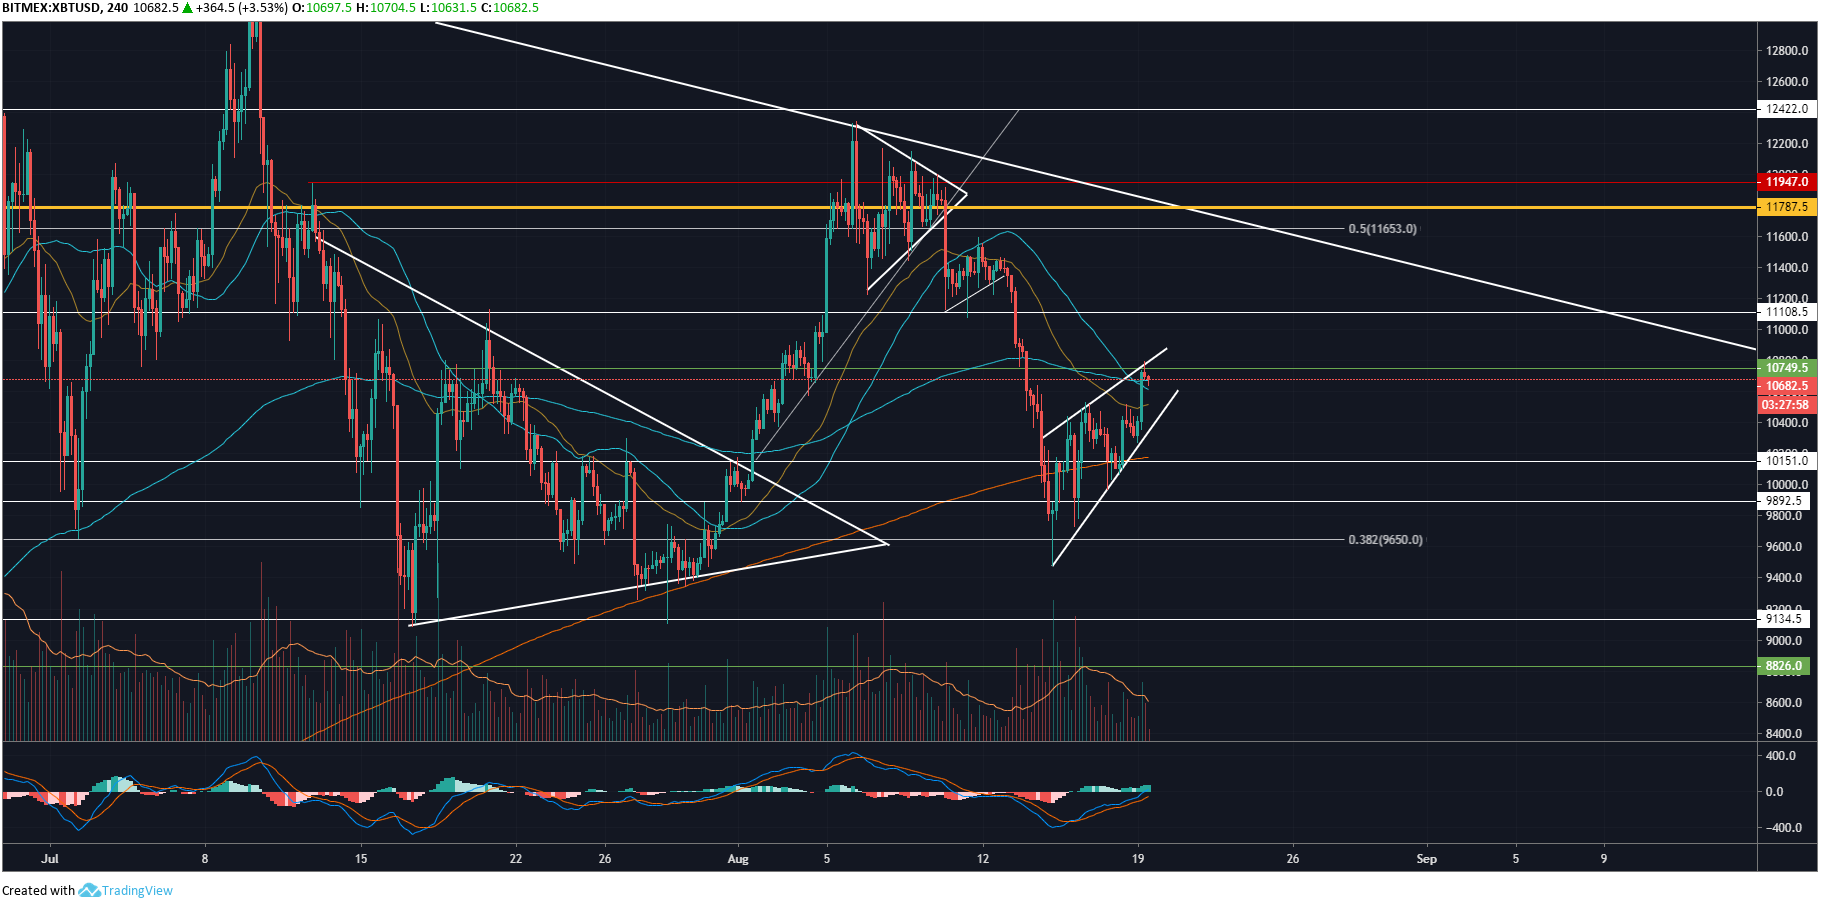
On the 4 hour chart for XBT/USD, we can see the descending volume within the most recent ascending wedge. This is a bearish sign as price action is rising yet volume is falling meaning the rising price action is unsustainable. Volume has also been descending throughout the last 6-8 weeks. MACD has just re-tested the median line at 0.0 despite decreasing volume making it likely MACD will reject crossing over the median line and create a lower low.
We should expect Bitcoin price levels to break-down out of the ascending wedge over the coming days, break below $9,600 and proceed to create a lower low around $8,800. However, if enough buying volume enters then there’s a chance key resistance at $11,100 will be broken. This will signify the start of a new bullish short-term trend.
To conclude, bitcoin is at a decision point as it trades close to the 200 EMA. We know if $11,100 is broken then further upside is expected. Adversely, if $9,600 is broken we know to expect further downside and perhaps a lower low.
Do you think BTC will create a lower low over the coming days and weeks? Please leave your thoughts in the comments below!
This article is strictly for educational purposes and should not be construed as financial advice.
Images via Shutterstock, XBT/USD charts by Tradingview
The post Bitcoin Price Analysis: Rising Wedge Could Drive BTC to $8.8K appeared first on Bitcoinist.com.

Bitcoinist.com is author of this content, TheBitcoinNews.com is is not responsible for the content of external sites.
Our Social Networks: Facebook Instagram Pinterest Reddit Telegram Twitter Youtube


