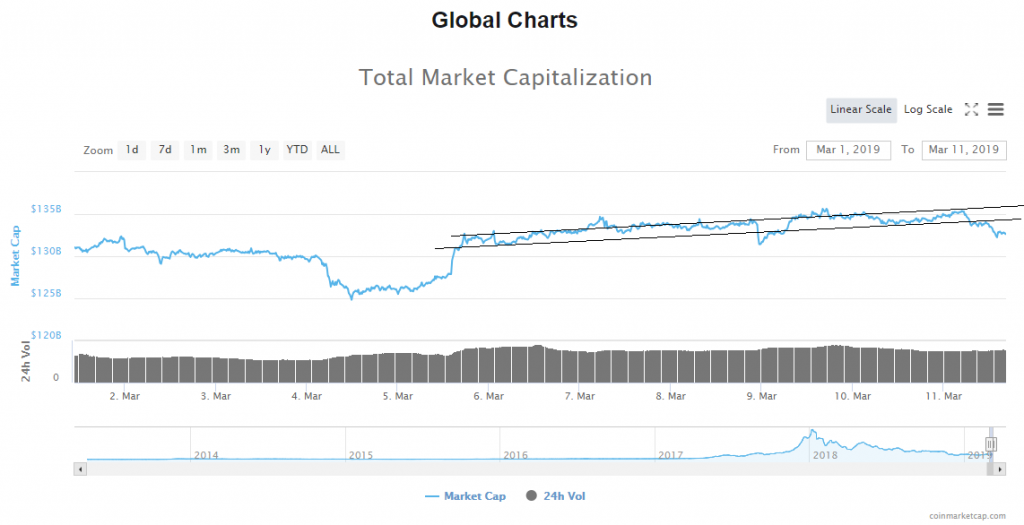
On Friday’s high the evaluation of the cryptocurrency market cap was $134,421,101,199.
From there the evaluation fell to around $131,56B on the same day, but since then it started increasing again and came up to $135,503,000,000 the following day which was the highest point over the weekend.
As the evaluation continued moving to the downside again and came to $132,223,000,000 at its lowest point today.
Trade Bitcoin with Bots: Read our Full Guide here
On the global chart, you can see that the evaluation has broken out from the ascending channel on the downside but this already happened one more time which means that we cannot say still that a breakout has occurred.
Consequently, the market is in red today with an average percentage of change among top 100 coins ranging around 1-2%.
Bitcoin’s market dominance has been hovering around the same levels but started increasing yesterday and came up from 51.49% to 51.78% at its highest point today.
BTC/USD
On Friday’s open when the price of Bitcoin was $3960 we have seen an increase at first but a straight downfall from $4021 to where the increase was made to $3851 at its lowest spiked which was a decrease of 4.23%.
After the price fell it started increasing again and came higher than previously to $4045 but when the price ended this bullish upswing the price started declining again and from there came to $3920 at its lowest point today but is currently sitting at $3942.4.

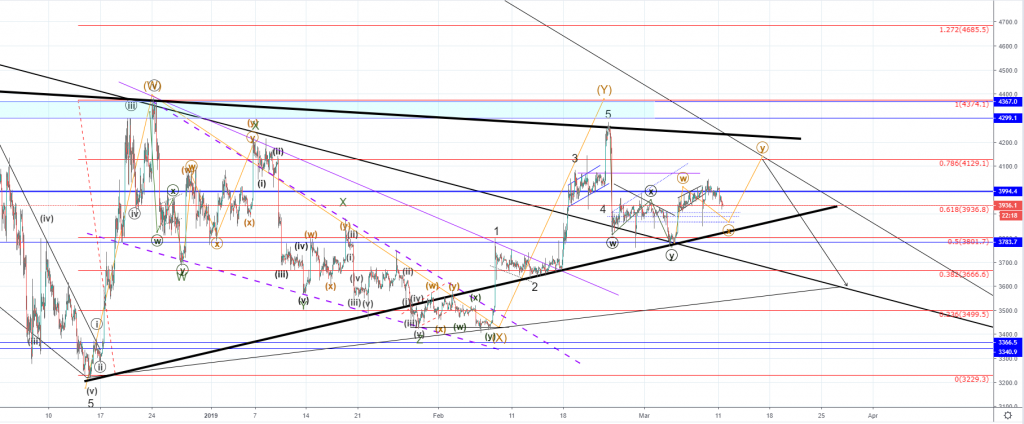
On the hourly chart, you can see that the price of Bitcoin is currently in a horizontal range between the 0.618 Fibo level which serves as a support and the $3994.4 horizontal resistance level.
But as the resistance line is more significant the price respected it more which is why we have seen a rejection at those levels today and the price is in a downward trajectory once more.
Now that the second Minute correction is taking place much as we saw when the Intermediate wave X started after the initial increase ended on the 24th of December.
We are soon going to see if my count gets validated but if it is correct the current downside movement would be the wave X from the second Minute correction which means that another 5-wave increase from here could occur before this correction ends.
This correction to the upside if occurs would most likely interact with some of the above-seen resistance levels out of which the intersection between the 0.786 Fibonacci level and the falling wedge resistance line is would be the area of interest.
This is in price terms around $4130, slightly lower then the first wave X ending point but if we are seeing the prolongation of the Intermediate correction after it ends we are to expect more downside for the price of Bitcoin as the next larger wave should start developing.
The target level for the expected decrease would be at around $3500-3600 area, but this doesn’t mean that the second wave X could end there as it could again be formed in a 5-wave manner like the first one.
We could see the price go above the 0.786 Fibonacci level in which case I would be expecting an interaction with the formed ascending triangle’s resistance which could lead to the price increase to $4230 before an impulsive down move starts.
Hourly chart technical is signaling a strong sell.
Pivot points
S3 3385.1
S2 3664.3
S1 3840.8
P 3943.5
R1 4120.0
R2 4222.7
R3 4501.9
Conclusion
As we have seen further sideways movement for the price of Bitcoin over the weekends now we are going to see another decisive move which is according to my analysis going to be most likely to the upside.
First an establishment of support is needed so this expected increase won’t happen immediately as the price of Bitcoin could fall further to $3870 before this move to the upside starts.
The upward move is set to retest the resistance levels, above which means that if it does we are going to see the price of Bitcoin between $4200-4100.
This would only be correctional as more downside would be expected from there as the third wave to the downside should start developing after the Intermediate Y wave ended which would most likely be the second wave X from the mentioned correction.
The post Bitcoin Price Prediction: Market Moving Sideways but an Increase above $4200 Expected appeared first on Blockonomi.

Blockonomi.com is author of this content, TheBitcoinNews.com is is not responsible for the content of external sites.
Our Social Networks: Facebook Instagram Pinterest Reddit Telegram Twitter Youtube


