- Ethereum has dropped in tandem with Bitcoin over the past few days.
- The leading cryptocurrency fell as low as $330 while BTC slipped to $10,400.
- While Ethereum has since recovered from those lows to $345, the coin is expected to resume its move lower.
- Analysts currently see the cryptocurrency moving towards the $300 region.
- While this short-term drop is expected, investors are optimistic because Ethereum is forming a medium-term falling wedge.
- A falling wedge is a textbook bullish pattern often seen in the middle of uptrends.
Ethereum Could See Short-Term Downside Towards $300
Ethereum is primed to move towards the $300 in the near term, a number of analysts have recently said. They note the cryptocurrency’s inability to move higher in the near term as ETH faces resistances in the $350-375 range.
One crypto analyst, the head of technical analysis at Blockfyre, recently shared the chart below with the following comment:
“Looks way more bearish SHORT term I 100% will go all in if this is given. It is my bullish invalidation point and thus optimal entry. More blood yet to come imo. Buy lower grey box or buy LH reclaim flip to support.”
Chart of ETH's price action since the start of 2020 with analysis by crypto trader/head of technical analysis at Blockfyre, Pentoshi (@pentosh1 on Twitter).
Chart from TradingView.com
As the chart shows, Ethereum has been printing a series of lower highs and lower lows since setting highs near the start of September. This suggests that a medium-term downtrend has been forming.
He’s not the only one that expects a move towards $300, then potentially lower.
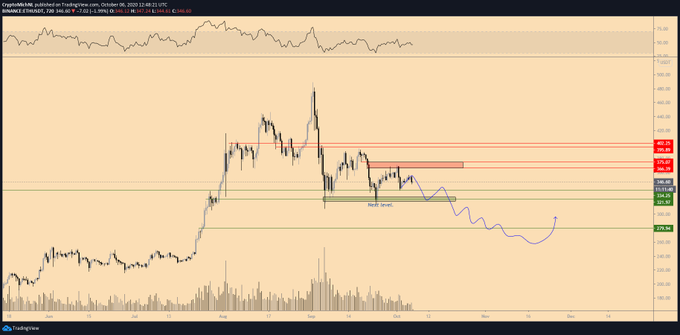
Michael Van De Poppe, a crypto analyst and a trader at the Amsterdam Stock Exchange, recently shared the chart below. Attached to the chart was a comment that Ethereum is prepared to slide towards $315, then likely even lower:
“$ETH #ETHEREUM Further downwards momentum to expect here. The crucial area that I’ll be interested in is $250-280. Since a while, actually.”
Chart of ETH's price action over the past few months with an analysis by crypto trader Michael Van De Poppe (@Cryptomichnl on Twitter).
Chart from TradingView.com
Wait on the Bounce
While Van De Poppe thinks ETH will move lower after testing $300, the first trader mentioned expects a bounce, as do others.
As the first chart in this article shows, once Ethereum reaches the $300 region, it will be trading two pivotal technical supports: 1) the high of the February rally at $290, and 2) a long-term moving average that has acted as support and resistance over the past few years.
The chart also shows that ETH is forming a falling wedge, which is a textbook technical pattern often seen prior to upward breakouts.
Should the falling wedge play out, once Ethereum reaches the $300 region, it will proceed to bounce back towards its highs.
Featured Image from Shutterstock
Price tags: ethusd, ethbtc
Charts from TradingView.com
Ethereum Primed to See Further Short-Term Losses Toward $300

Bitcoinist.com is author of this content, TheBitcoinNews.com is is not responsible for the content of external sites.
Our Social Networks: Facebook Instagram Pinterest Reddit Telegram Twitter Youtube


