As technicians, we approach markets of any kind armed with the insight that, at the most basic level, any market is merely a crowd of people.
As history shows quite clearly – and as an insight that forms the very foundation of the field of statistics – while individuals are impossible to predict with any large sample accuracy, a crowd of people is a very predictable object over time.
This is, in fact, the most basic insight that drives the field of technical analysis.
As the crypto complex progresses in its evolution toward being perhaps the world’s next big asset class, trading volumes and liquidity levels continue to rise, and charts for many different coins continue to build out in terms of a history littered with formations, patterns, and levels that grow over time in significance as they are reinforced, repeated, or broken. This process suggests a growing importance for traditional hard-core technical analysis as a market tool and a source of edge for crypto traders going forward.
With that in mind, we will be taking a close look at two charts today, each of which carries very interesting features, particularly when it comes to casting and reading the tea leaves over the near future.
IOTA (MIOTA)

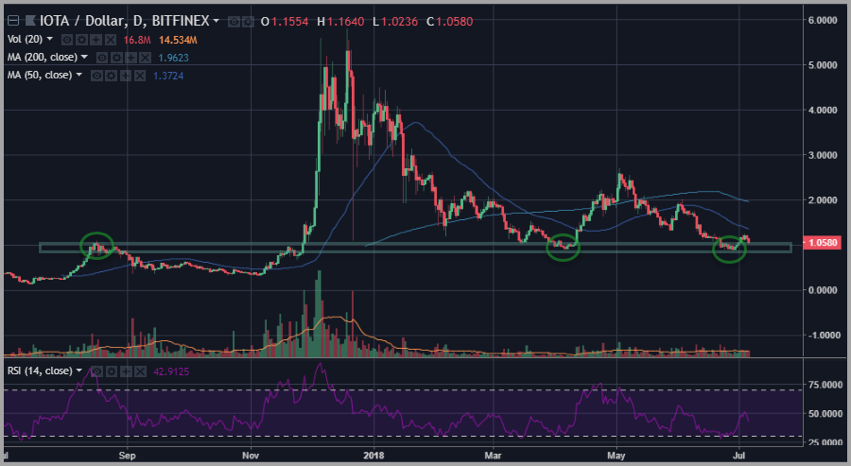
The IOTA chart is powerfully defined by the one dollar level. As you can see in the image above, this level was key resistance last year, defining a couple of important highs before releasing into a massive acceleration higher in late November and early December at the height of the bubble blow-off stage for Bitcoin.
With the bursting of the Bitcoin mania, the crypto complex as a whole has been mired in a bear market context during the first half of 2018.
However, we are increasingly seeing signs of potential key support begin to come into play for many coins, IOTA being another excellent example.
IOTA formed an initial pivot low at the $1 level in early April and has just recently retested that level in late June trading.
Sentiment in the cryptocurrency complex has become extremely sour, suggesting that many charts such as this one could potentially be washed out at this point.
Traders focused on IOTA for the prospect of near-term gains should look for this key support level at the $1 area to hold firm and lead to an eventual breakout back above the 50-day simple moving average shown here.
If that type of pattern manifests itself, it could lead to a very quick range test of the highs that we’ve seen over the last several months, providing for a technical target of triple-digit percentage possibilities for IOTA bulls.
But the first order of business is to continue to see key support hold and signal that a sustainable base has been constructed by deeper pockets moving into this coin.
EOS (EOS)

For traders focused on EOS, there is a lot to be gained by a critical focus on the pattern we see defining this chart over the past eight months.
As should be visible in the chart above, EOS is playing out a clear bullish trend with higher highs and higher lows, defined primarily by the trendline shown in the image as the dotted line.
This trend was initially defined by the pivot low formed in mid-March of this year through a minor violation of support at the $5 level. That pivot low was marked most significantly by an oversold print in the 14 day RSI measure – the first such print seen in EOS this year. In other words, this pullback (which also happened to resolve at a key Fibonacci level) came within the context of an upwardly biased tape over recent months and formed a higher low with a major oversold reading in a key oscillator.
In point of fact, this is a textbook rhythm for an upwardly trending market. From that point, EOS quadrupled in price in just about a month with an aggressive move in April.
Since that pivot high topped, we have seen a sharp correction right back to that key defining upward trend line, culminating in another clear oversold RSI print, this time at the $7.50 level – the only oversold RSI print that we’ve seen since the pivot low scored in mid-March.
Once again, we have a textbook pattern defining an upwardly trending market. This suggests the possibility that the next wave higher is setting up to get started soon. One can easily measure risk on a strategy to take advantage of this by simply being willing to hold onto a position here until or unless that key trendline is broken to the downside.
For the latest cryptocurrency news, join our Telegram!
Disclaimer: This article should not be taken as, and is not intended to provide, investment advice. Global Coin Report and/or its affiliates, employees, writers, and subcontractors are cryptocurrency investors and from time to time may or may not have holdings in some of the coins or tokens they cover. Please conduct your own thorough research before investing in any cryptocurrency and read our full disclaimer.
Image courtesy of Pexels
Charts courtesy of tradingview.com
The post IOTA and EOS Present Technical Factors of Major Near-Term Interest appeared first on Global Coin Report.

Globalcoinreport.com/ is author of this content, TheBitcoinNews.com is is not responsible for the content of external sites.
Our Social Networks: Facebook Instagram Pinterest Reddit Telegram Twitter Youtube


