


It’s certainly no secret that recent action has been tough to swallow for overleveraged bulls with established positions from poor entry levels in the cryptocurrency complex.
With that in mind, we would like to take a close look at Litecoin (LTC) and IOTA today to keep a “weather eye” on the horizon for potential technical signals that may serve as early warning signs of a shift in the current trend beginning to take root.
Litecoin (LTC)
Price Analysis:
- High: $78.11
- Low: $74.40
- Major Resistance Level: $87.00
- Hourly MACD: Steady Downside Momentum
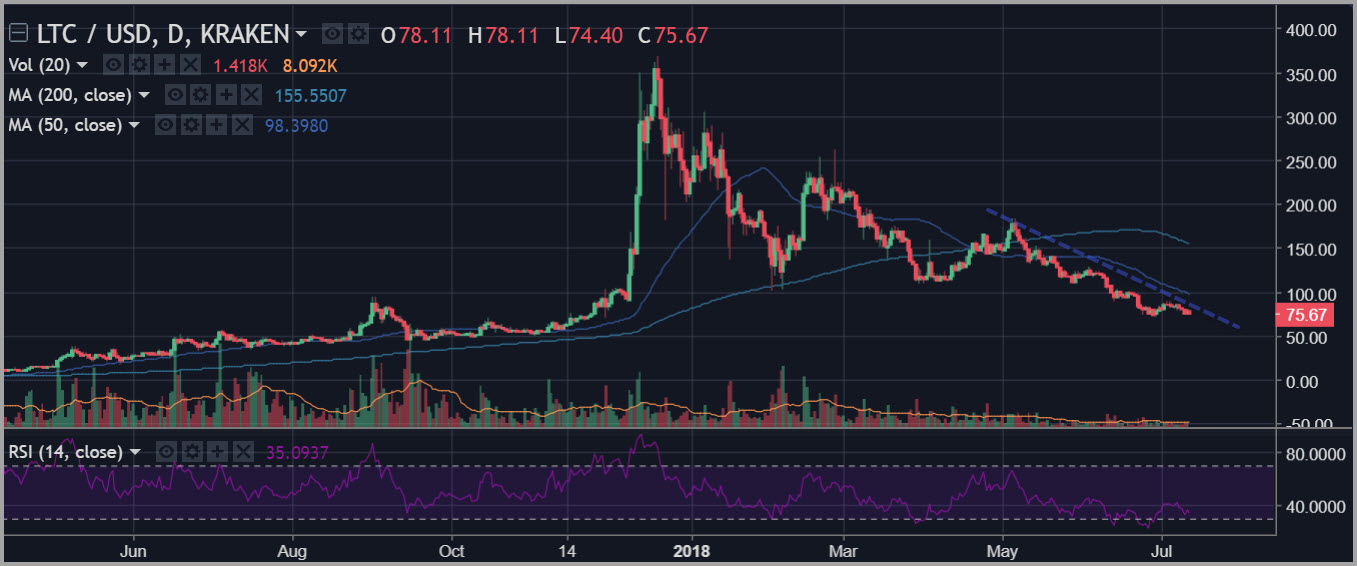
Litecoin (LTC) has been a clear underperformer when compared to many other large market cap coins over the past ten weeks. The action continues to be situated well beneath the coin’s major moving averages, which all happen to also be downward-sloped at present, suggesting an intensification of selling evident on the chart during that period.
For Litecoin (LTC), the key here appears to be the coin’s recent test and breach of the $80 level, which defines the action in many ways over the past year. This level first played its part in the form of an important resistance level during the second half of 2017. However, late in the year, we saw a breakout and a sharp extension higher that quickly quadrupled the price of LTC in a matter of weeks.
The correction that ensued following that move has taken us all the way back down to test this key breakout zone, establishing new levels of oversold readings in a number of different indicators, including the MACD and the 14-day RSI – two indicators widely watched by market technicians.
Given that we have some very important levels in play, this may be a particularly important time to watch for a divergence among these indicators whereby we see lower lows for the coin in terms of price levels, while matching up higher lows in the major oscillators.
IOTA (IOTA)
Price Analysis:
- High: $1.008
- Low: $0.936
- Major Resistance Level: $1.20
- Hourly MACD: Steady Downside Momentum
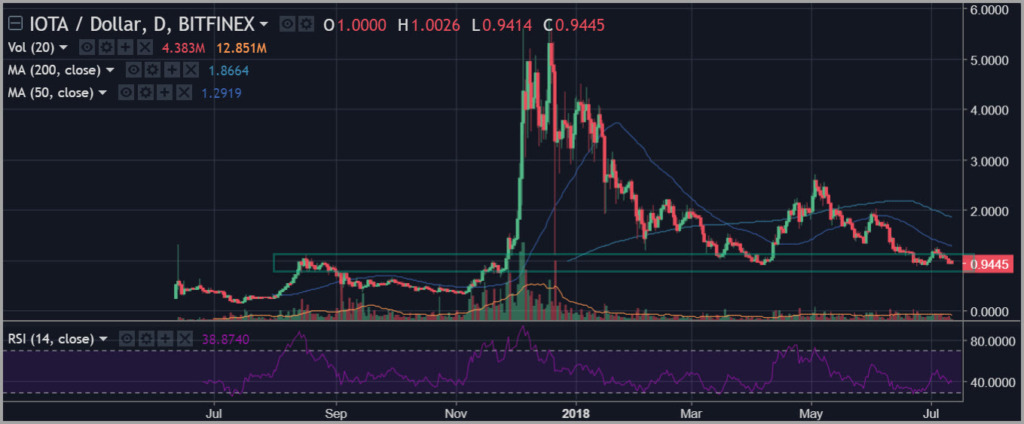
IOTA has a very similar chart history to Litecoin (LTC), but with perhaps an embedded sense of relative strength in terms of price levels achieved during the course of the recent bearish trend across the cryptocurrency complex.
In fact, IOTA is currently holding onto support that represents prior resistance from late last year before the coin’s breakout and sprint higher in December. This sets up the potential for a make-or-break level in play at the $0.90 area.
We will be monitoring the action around this zone very closely given that this coin has held this level on two important occasions over the last six months, suggesting the potential that a deeper-pocketed accumulation bid may be at work here supporting IOTA and providing this chart with an apparent sense of relative strength.
Happy Trading!!
For the latest cryptocurrency news, join our Telegram!
Disclaimer: This article should not be taken as, and is not intended to provide, investment advice. Global Coin Report and/or its affiliates, employees, writers, and subcontractors are cryptocurrency investors and from time to time may or may not have holdings in some of the coins or tokens they cover. Please conduct your own thorough research before investing in any cryptocurrency and read our full disclaimer.
Image courtesy of Pexels
Charts courtesy of tradingview.com
The post Litecoin (LTC) IOTA (MIOTA) Price Analysis – Are We Nearing Inflection? appeared first on Global Coin Report.

Globalcoinreport.com/ is author of this content, TheBitcoinNews.com is is not responsible for the content of external sites.
Our Social Networks: Facebook Instagram Pinterest Reddit Telegram Twitter Youtube


