Bitcoin price climbed higher and rebounded towards the $4,000 resistance area. BTC is facing a strong resistance near $4,000, above which it could accelerate higher. Likewise, altcoins like Ethereum (ETH), ripple (XRP), bitcoin cash (BCH), litecoin (LTC) and EOS are facing significant resistances.
Key Takeaways:
- Bitcoin price found support above $3,760 and rebounded above $3,800 and $3,850.
- Ethereum price bounced back from the $125-126 support area, but faced sellers near $144.
- Ripple price is still forming an important breakout pattern above the $0.3050 support.
- EOS surged higher before it faced sellers near the $4.00 resistance.
- SNPC, BTMX, GOT and RVN gained more than 150% during the past 7 days.
Bitcoin Price Analysis
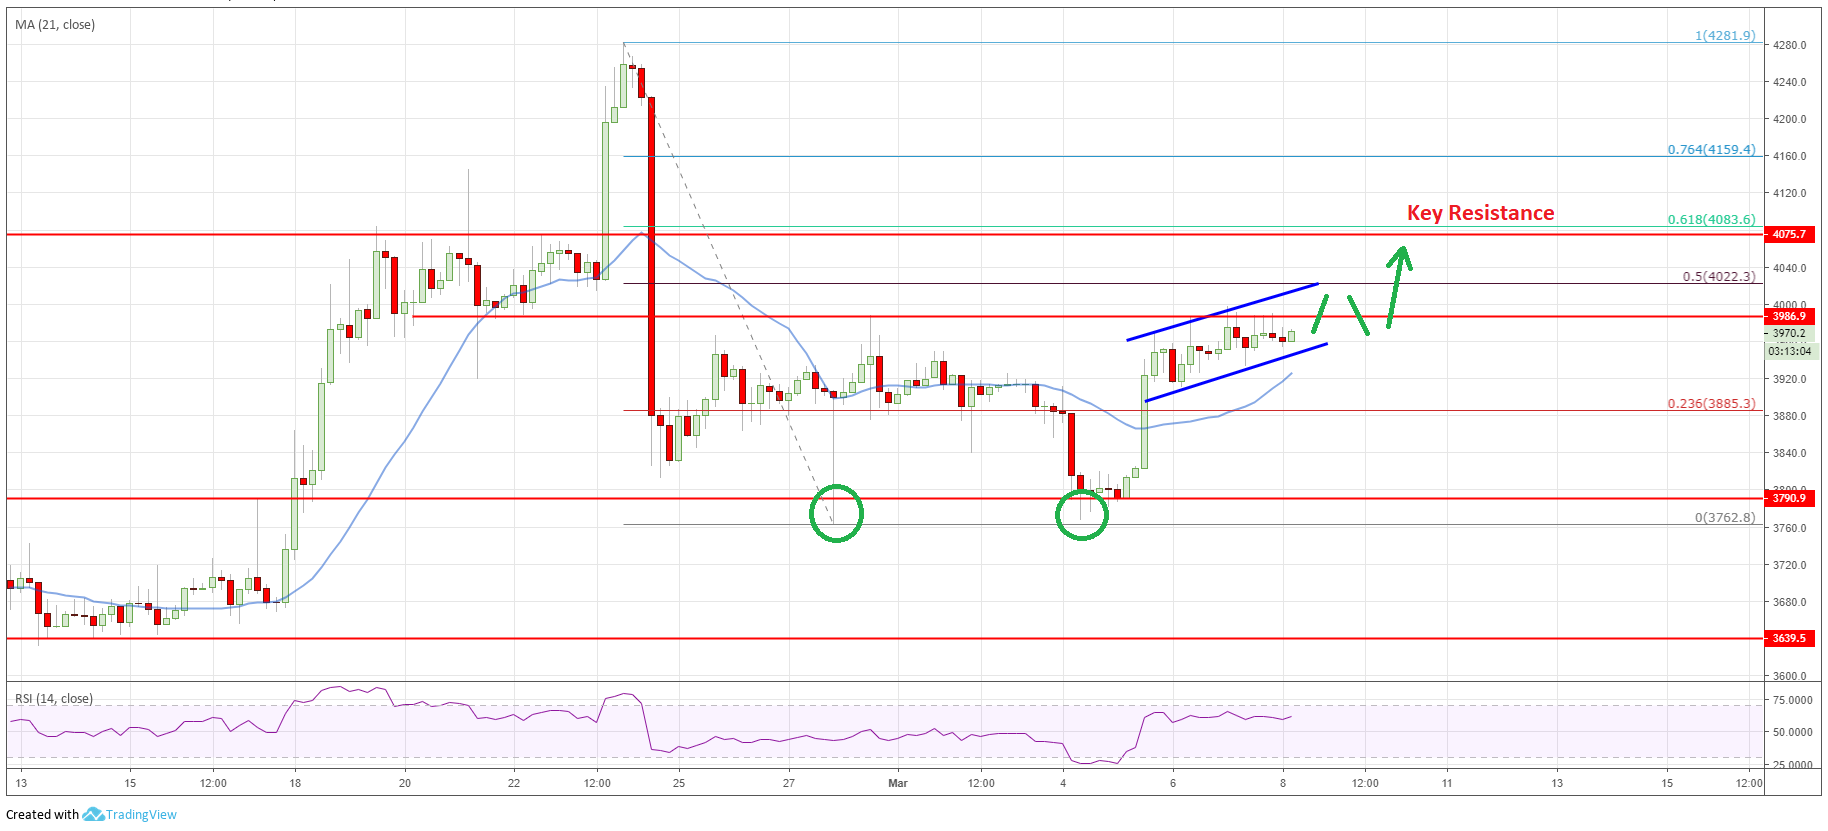
After a downside correction, bitcoin price found support above the $3,750 and $3,760 support levels. BTC/USD traded as low as $3,762 and later started a fresh upward move above the $3,800 and $3,850 resistance levels.
Bitcoin Price Chart: Click to Enlarge
Looking at the 4-hours chart, the price likely formed a double bottom pattern near the $3,762 level. It traded higher above the $3,850 resistance level to move into a positive zone.
During the climb, the price broke the 23.6% Fib retracement level of the last decline from the $4,281 high to $3,762 low. There was even a close above the $3,900 resistance level and the 21 simple moving average (4-hours).
However, the price ran into a significant resistance near the $4,000 level, which was a support earlier and it is now acting as a crucial hurdle for buyers. At the moment, there is a short-term ascending channel in place with support at $3,940.
If the price breaks the channel support, it could test the $3,900 support or the 21 simple moving average (4-hours). The next key support is at $3,850, below which the price could slide towards $3,800.
On the other hand, an upside break above the $4,000 barrier may perhaps clear the path for more gains. The next resistance is near $4,025 and the 50% Fib retracement level of the last decline from the $4,281 high to $3,762 low.
However, the main hurdle above $4,000 is near the $4,075 level, where sellers are likely to emerge. Overall, bitcoin price is testing a crucial resistance near $4,000 and it could either surge towards $4,250 or decline back to $3,800.
Ethereum Price Analysis
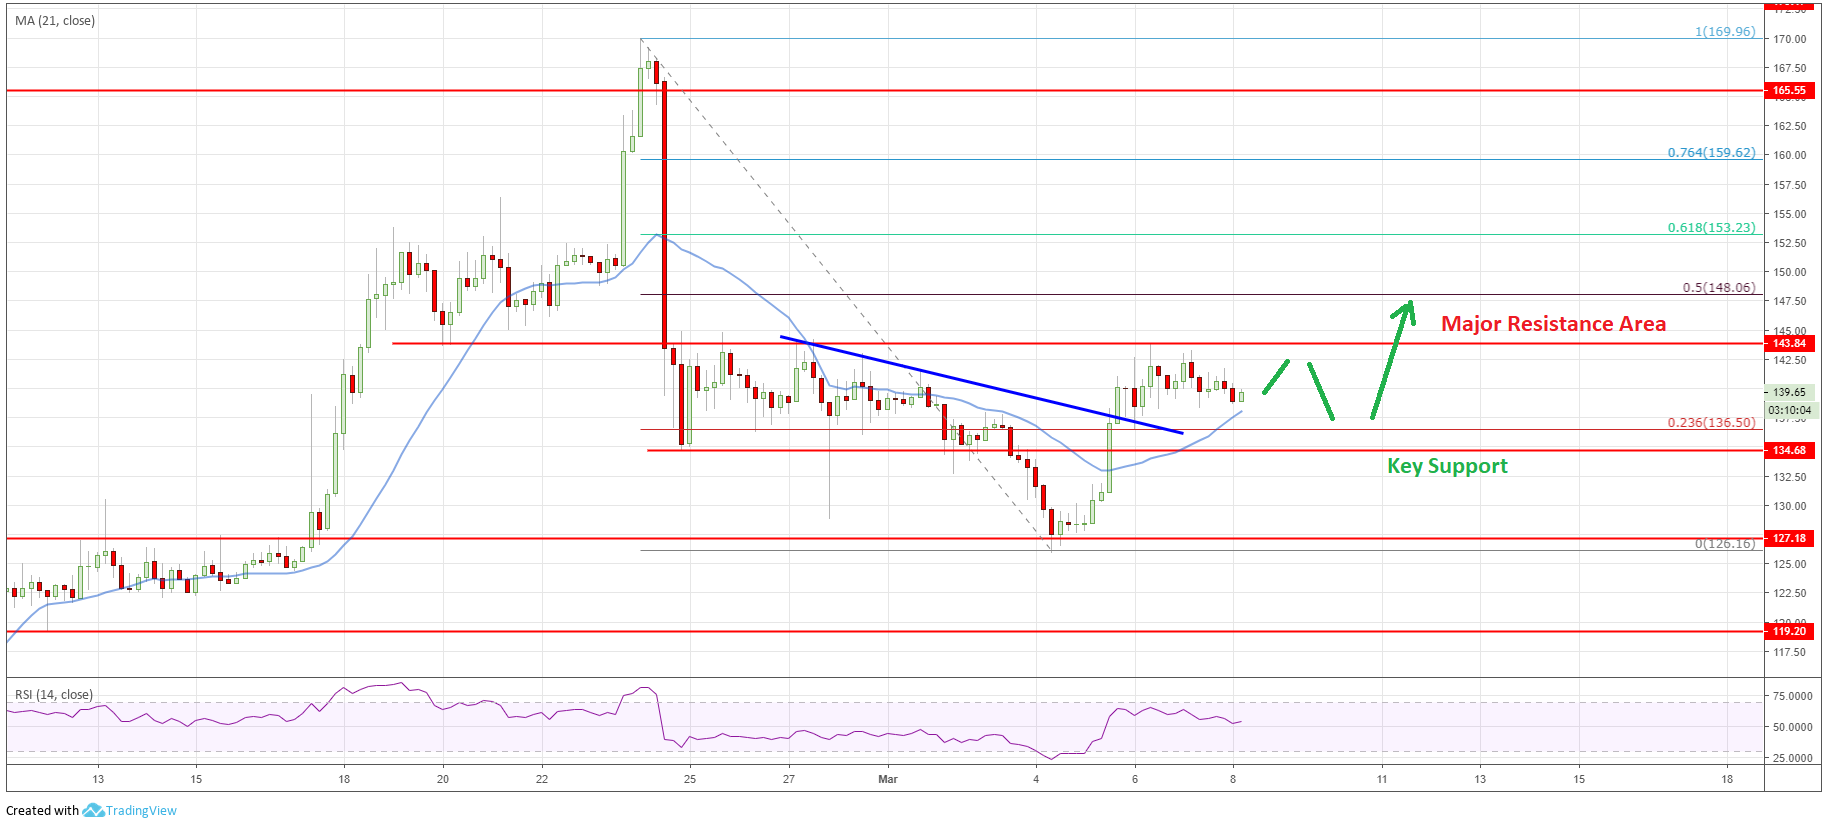
Ethereum price extended losses below the $135 support level and traded below $130. ETH/USD tested the $125-126 support area, where buyers took a stand and later the price started a fresh rebound above the $130 level.
Ethereum Price Chart: Click to Enlarge
Looking at the 4-hours chart, the price traded as low as $126 and later bounced back above the $130 and $135 resistance levels. There was a break above the 23.6% Fib retracement level of the last decline from the $170 high to $126 low.
There was a close above the $135 resistance and the 21 simple moving average (4-hours). Besides, the price cleared a connecting bearish trend lien with resistance at $126 on the same chart.
However, the price faced a significant resistance near the $143-144 zone, which was a support earlier. The price is currently consolidating gains and correcting lower towards the $138 level. An immediate support is near the 21 simple moving average (4-hours).
If there is a break below the 21 simple moving average (4-hours), the price could test the $135 support level. Below $135, sellers are likely to take control and the price could decline towards the $130 level.
On the other hand, a successful break above $144 may push the price towards the $148 level. It represents the 50% Fib retracement level of the last decline from the $170 high to $126 low. If the price continues to gain momentum, it could trade above $152 and $155.
Ripple Price Analysis
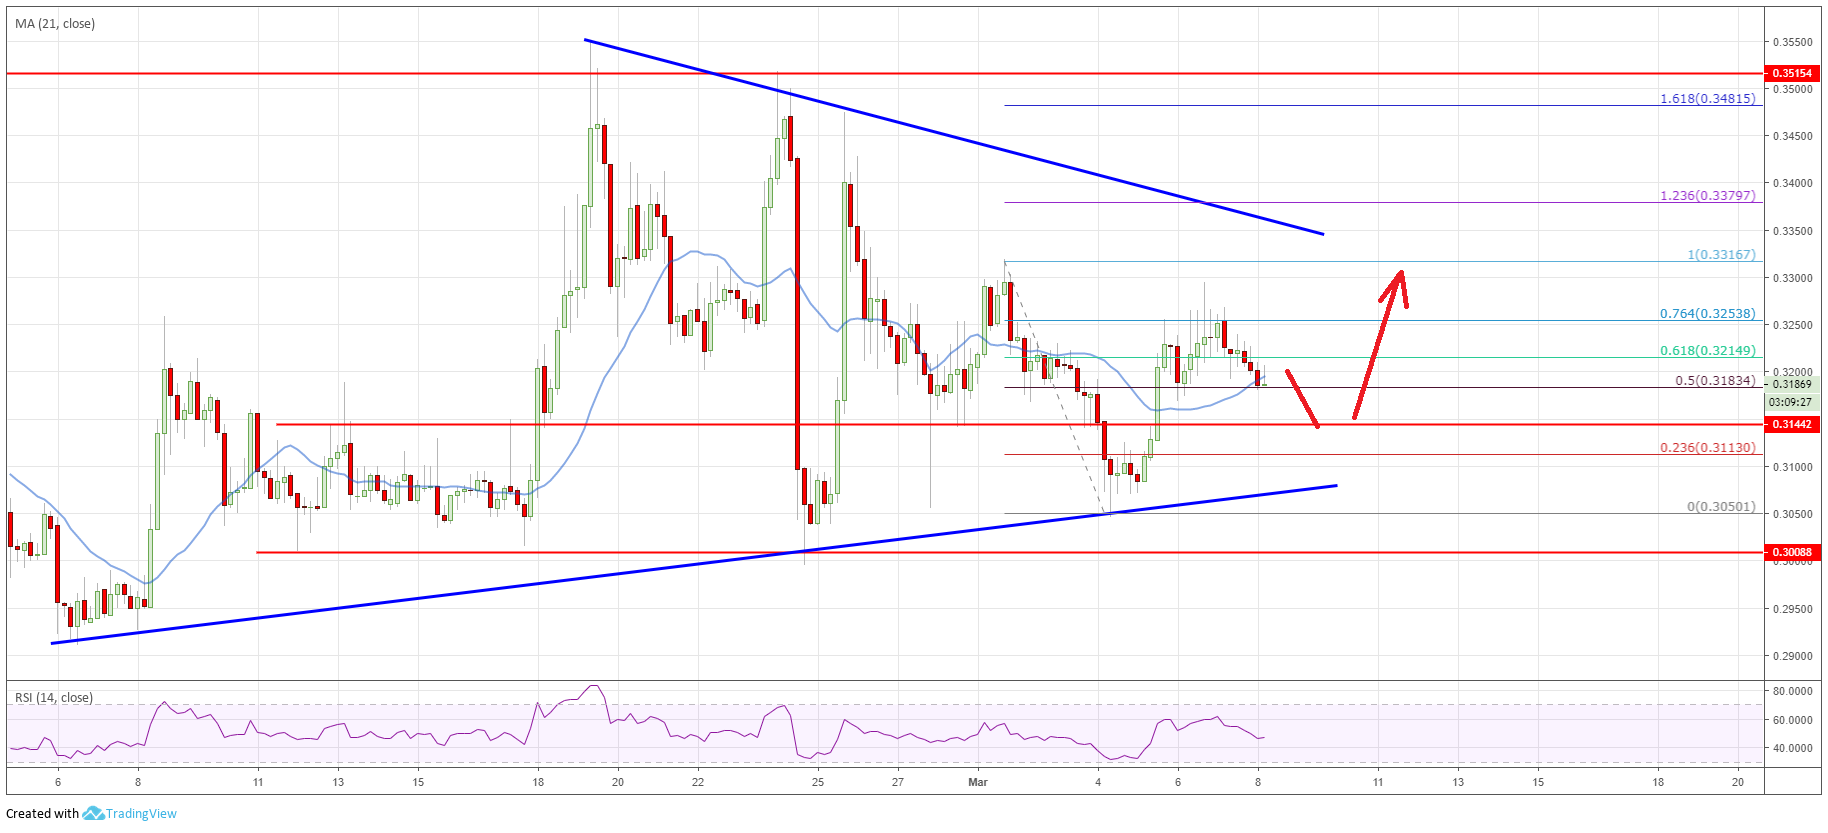
Ripple price formed many lower highs recently and traded with a bearish bias below the $0.3400 and $0.3500 resistance levels against the US Dollar. XRP/USD traded as high as $0.3316 recently before it declined towards the $0.3050 support level.
Ripple Price Chart: Click to Enlarge
Looking at the 4-hours chart, the price traded as low as $0.3050 recently before correcting higher above $0.3145. The price recovered above the $0.3180 resistance and the 21 simple moving average (4-hours).
There was a break above the 50% Fib retracement level of the last decline from the $0.3316 high to $0.3050 low. However, the $0.3330 level acted as a strong resistance. The price failed to test the $0.3317 swing high and it is currently consolidating in a range.
More importantly, it seems like there is a crucial contracting triangle pattern is formed with resistance near the $0.3350 level and support at $0.3060. On the upside, the triangle resistance coincides with the 1.236 Fib extension level of the last decline from the $0.3316 high to $0.3050 low.
If there is a break above the $0.3300 and $0.3350 resistance levels, the price could rally above the $0.3400 level. On the other hand, the $0.3060 and $0.3050 support are likely to play an important role in the near term.
EOS Price Analysis
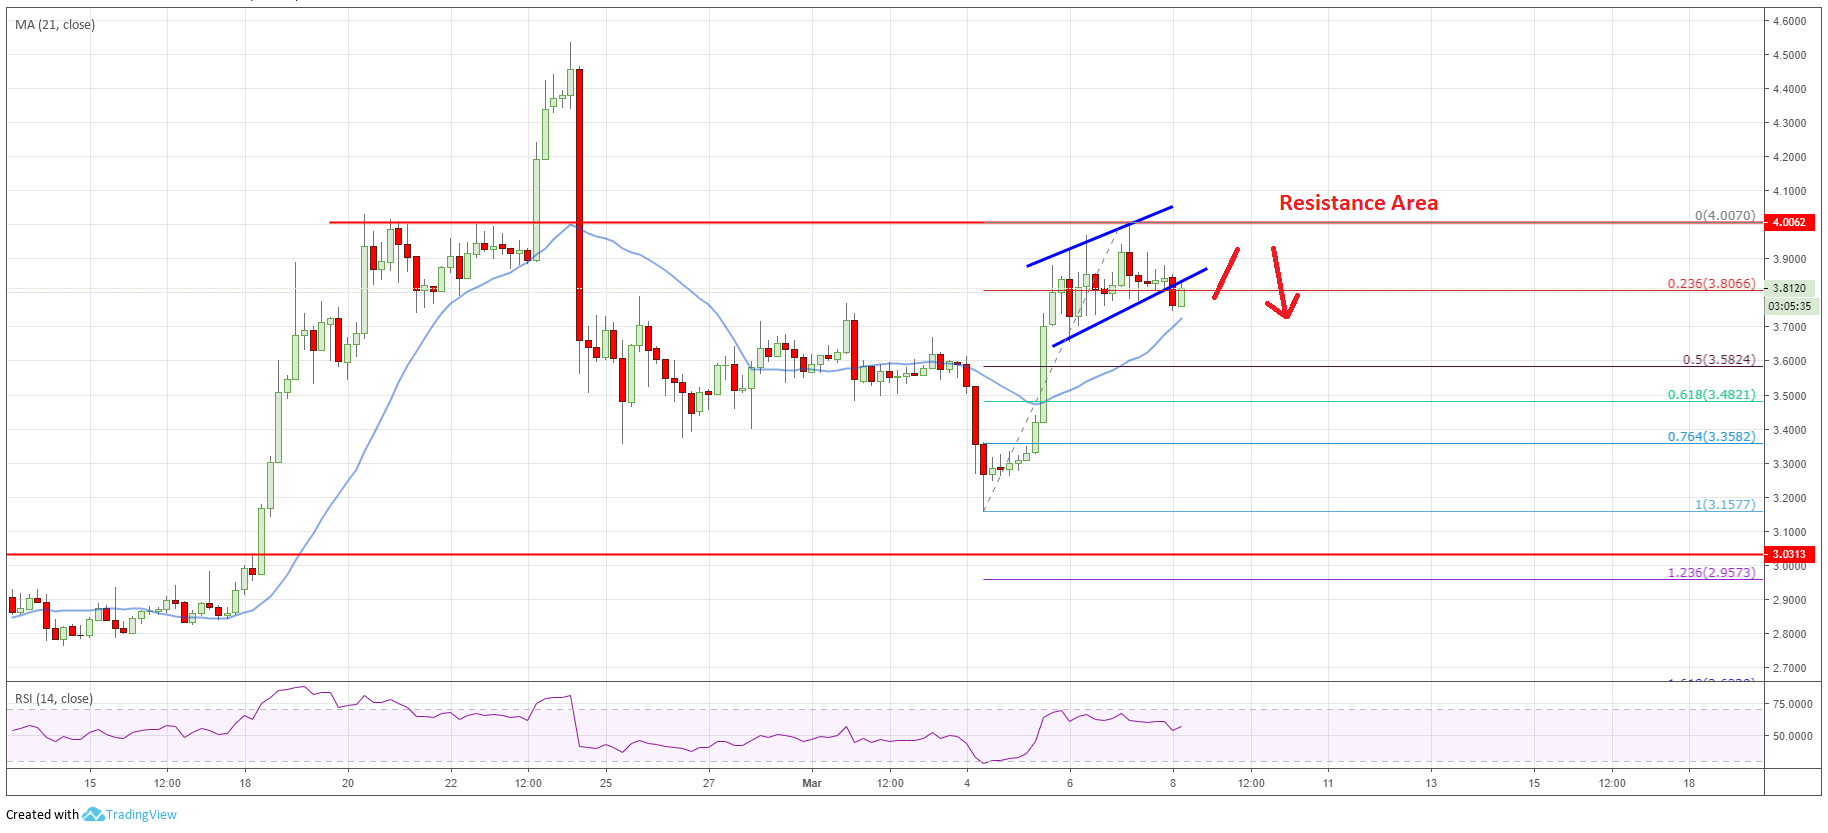
EOS price made a couple of swing moves above the $3.20 and $3.40 support levels against the US Dollar. The price declined sharply below $3.50 before buyers appeared near the $3.20 support area.
EOS Price Chart: Click to Enlarge
Looking at the 4-hours chart, the price traded as low at $3.15 and later bounced back sharply. There were strong bullish moves and the price traded above the $3.40 and $3.50 resistance levels.
There was even a close above the $3.70 resistance and the 21 simple moving average (4-hours). Buyers pushed the price towards the $4.00 resistance, where sellers took a stand. A high was formed near $4.00 and the price later corrected lower.
It broke a short term ascending channel with support at $3.80 and the 23.6% Fib retracement level of the last wave from the $3.15 low to $4.00 high.
An immediate support is near the $3.70 level and the 21 simple moving average (4-hours). If there is a break below $3.70, the price could test the $3.58 level and the 50% Fib retracement level of the last wave from the $3.15 low to $4.00 high.
To climb further higher, the price must break the $4.00 resistance level. The next key hurdles for buyers are near the $4.20 and $4.28 levels, followed by $4.35.
Top Gainers
During the past 7 days, a few small cap altcoins surged higher by more than 100%, including SNPC, BTMX, GOT, RVN, TX, PEPECASH, HPC, QUAN, ADB and CONI (trading volume more than $50K). Out of these, SNPC rallied around 300% and BTMX gained nearly 275%.
Overall, bitcoin price moved nicely above the $3,800 and $3,900 resistance levels. However, BTC is clearly struggling near the $4,000 resistance level. Therefore, it could either break $4,000 and climb further higher or start a fresh decline. If there is a bearish reaction, altcoins such as Ethereum, ripple, bitcoin cash, EOS, TRX, XLM, ADA, LTC, BNB and XMR could slide in the near term.
The market data is provided by TradingView, Bitfinex.
The post Price Watch: Bitcoin, Ethereum, Ripple & EOS Price Analysis 8th March appeared first on Blockonomi.

Blockonomi.com is author of this content, TheBitcoinNews.com is is not responsible for the content of external sites.
Our Social Networks: Facebook Instagram Pinterest Reddit Telegram Twitter Youtube


