


Tron (TRX) is trying to strengthen its position around the $0.035 level against the US dollar and is very slowly moving upwards.
XRP is trying to make a break through the $0.4620 level against the US dollar after crossing the $0.45 USD.
Tron (TRX/USD)
Price Analysis
- High: $0.0364 USD
- Low: $0.0350 USD
- Major Resistance Level: $0.040
- Hourly MACD: Placed slightly in the Sell region.
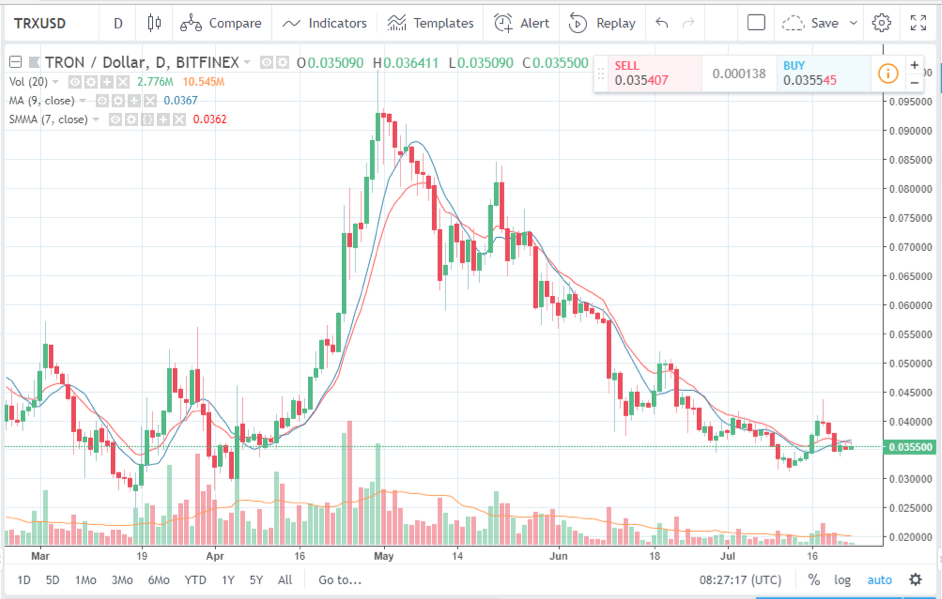
After experiencing a short uptrend last week, from 18th July 2018 onwards the price of Tron against US dollars had been showing red candles. In between, on 21st July a small green candle had formed. Today, so far the price action candle of TRX/USD is in green with the price at the time of writing showing $0.0355 USD. (As of 23rd July 2018) As can be observed from the chart, the TRX/USD pair has been largely experiencing downtrends since early March. If seen holistically, the cryptocurrency market has been showing more red signals than green from the beginning of 2018 itself.
The price of the TRX/USD pair had fallen below the $0.035 level and is currently trying to correct its position along the $0.035 line. The moving average (blue line), at the time of writing points at 0.0367. This indicates that the short-term uptrend, observed at the moment may continue for today at least. The ‘secret project’ of Tron is slated to be made public on 31st July. This is likely to generate some excitement and create pressure on the buyers, pushing the price in the upward direction. However, at the moment the hourly MACD shows that the pressure is on the sellers.
Ripple (XRP/USD)
Price Analysis
- High: $0.4637 USD
- Low: $0.4473 USD
- Major Resistance Level: Near about $0.52
- Hourly MACD: Placed slightly in the Sell region.
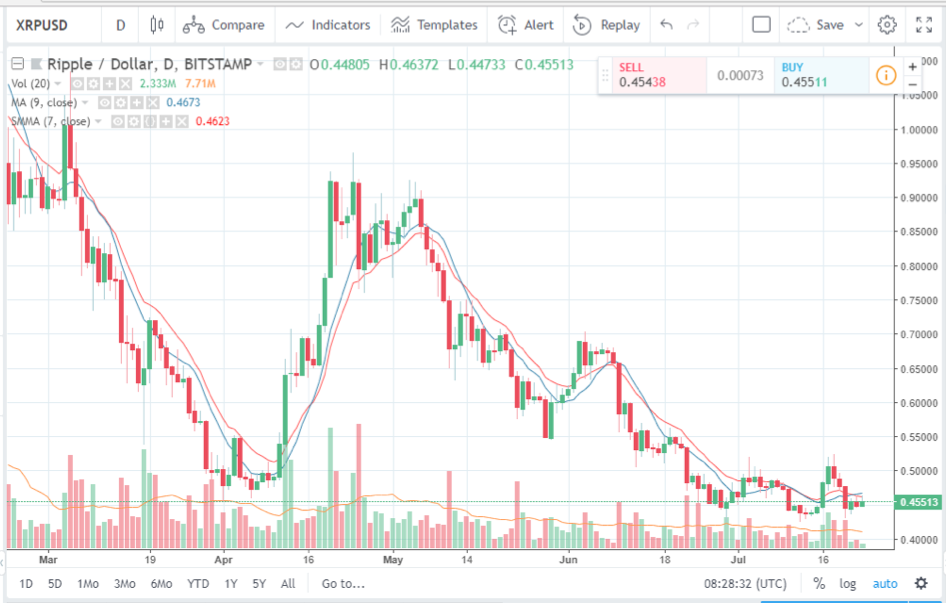
The XRP/USD had been facing a situation similar to that of Tron (TRX) with the price going down again from 18th July 2018. Currently, as can be observed from the chart, the price action of Ripple (XRP) against the US dollar has been sporting a green candle. At the time of writing, the price of the XRP/USD pair shows $0.4551 approximately. Ripple’s price fell from above $0.5000 last week to below $0.4500. The pair had crossed the $0.4600 and $0.4500 support levels. The moving average (blue line) at the time of writing marks at 0.4673. At one point, the price had marked as low as $0.4292 USD when the buyers strengthened and stopped the price from moving further below. The XRP/USD pair had moved above Fibonacci retracement level 23.6% when dropping from $0.5204 high to $0.4292 low. At the $0.4620 level and the 100 hourly SMA, Ripple was resisted strongly. The 38.2% Fibonacci retracement level of this fall also prevented upsides. If the price of the XRP/USD becomes strong at the $0.4650 level then, one can expect the price to move upwards to the $0.5000 level. The hourly MACD is currently placed slightly in the Sell zone.
As observed from the charts, both Tron and Ripple are trying to correct their positions against the US dollar after the drop last week.
Happy Trading~
For the latest cryptocurrency news, join our Telegram!
Disclaimer: This article should not be taken as, and is not intended to provide, investment advice. Global Coin Report and/or its affiliates, employees, writers, and subcontractors are cryptocurrency investors and from time to time may or may not have holdings in some of the coins or tokens they cover. Please conduct your own thorough research before investing in any cryptocurrency and read our full disclaimer.
Image courtesy of Pexels
Charts courtesy of tradingview.com
The post Tron, XRP Price Analysis: Correcting their Positions appeared first on Global Coin Report.
Read more at https://globalcoinreport.com/tron-xrp-price-analysis-correcting-their-positions/

Globalcoinreport.com/ is author of this content, TheBitcoinNews.com is is not responsible for the content of external sites.
Our Social Networks: Facebook Instagram Pinterest Reddit Telegram Twitter Youtube


