While crypto-focused technical analysts often spend the majority of their time on individual cryptocurrencies with charts priced in dollars, some of the best technical setups and opportunities are often found in key pairs.
Today, we’re going to focus on the technical pictures for ETH/BTC and ETC/BTC, which should give us an idea of relative strength among major large-cap coins as well as allow for detection of buy and sell signals in these important pairs.
ETH/BTC
Price Analysis
- High: 0.046336
- Low: 0.044795
- 24-Hour Volume: 7.188K
- MACD Signal: Sell

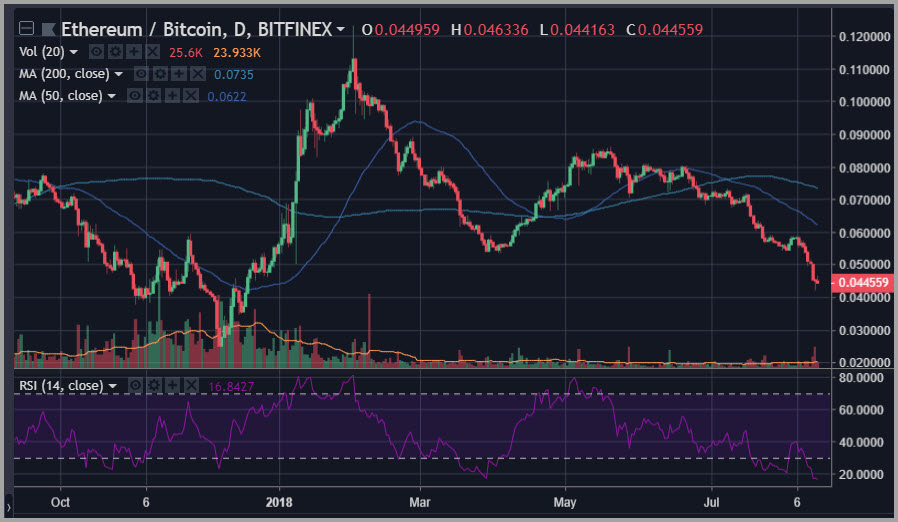
ETH/BTC is the classic pairing, pitting the two arguably most important coins against one another.
The story here really depends upon your time frame. Looking over the longer time frame – going back 18 months to two years – shows us clear outperformance for those long this pairing.
However, over the past two months, the relative picture has been moving sharply in the opposite direction, with the chart for the ETH/BTC pairing breaking sharply underneath its major moving averages to take out its late March and early April lows.
The 14-day RSI indicator is now down printing in the teens showing a severe oversold state. But, as they say, “the trend is your friend”, even if this particular trend has hardly been friendly for those holding exposure long ETH/BTC.
ETC/BTC
Price Analysis
- High: 0.002004
- Low: 0.0019062
- 24-Hour Volume: 50.871K
- MACD Signal: Sell

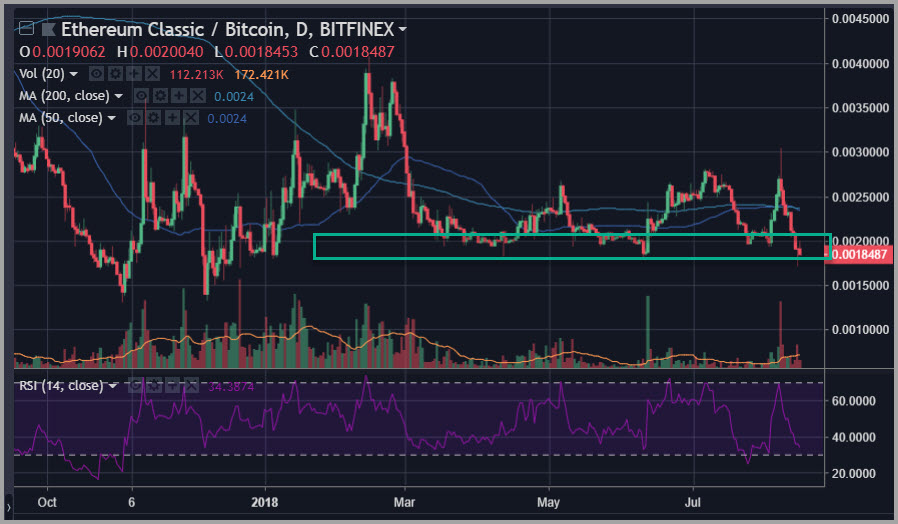
ETC/BTC has been extraordinarily steady in maintaining a tight trading range going all the way back to October 2017.
However, given the fact that ETC is now more readily tradable in fiat currency terms based on growing acceptance among exchanges, we may be about to see this change.
At this point, the ETC/BTC pair has been holding support in its trading range just underneath the 0.002 level, which has acted like a shelf of support for the majority of 2018.
If the widespread assumption about Bitcoin needing to lead the way higher for the cryptocurrency complex as a whole turns out to be on target, then ETC/BTC may well be about to retest its late 2017 lows now that it has broken solidly beneath all of its major moving averages over the past 10 days.
Happy Trading~
To trade cryptocurrencies, sign up with BitMex or Binance!
Disclaimer: This article should not be taken as, and is not intended to provide, investment advice. Global Coin Report and/or its affiliates, employees, writers, and subcontractors are cryptocurrency investors and from time to time may or may not have holdings in some of the coins or tokens they cover. Please conduct your own thorough research before investing in any cryptocurrency and read our full disclaimer.
Image courtesy of Pexels
Charts courtesy of tradingview.com
The post ETH/BTC and ETC/BTC Price Analysis: Pay Attention to the Signals Here appeared first on Global Coin Report.
Read more at https://globalcoinreport.com/eth-btc-and-etc-btc-price-analysis-pay-attention-to-the-signals-here/

Globalcoinreport.com/ is author of this content, TheBitcoinNews.com is is not responsible for the content of external sites.
Our Social Networks: Facebook Instagram Pinterest Reddit Telegram Twitter Youtube


