


There’s no doubt that since last December Litecoin (LTC) has found the going a bit treacherous succumbing from its all-time high print of $370 on 12-19-17 coupled with the announcement that Charlie Lee would be liquidating a sizeable stake in LTC near noted all-time highs.
Over the course of a three and a half month period from mid-December to the end of March ’18, where LTC appears to have bottomed-out in the $110 area, Litecoin witnessed price erosion of 70%, much like many throughout the cryptocurrency universe.
With the worst appearing to be in the rear-view mirror, we can observe from the daily chart below that LTC seems to have found its footing and in doing so, has recently broken above its downtrend line as well as recapturing its 200-Day moving average.
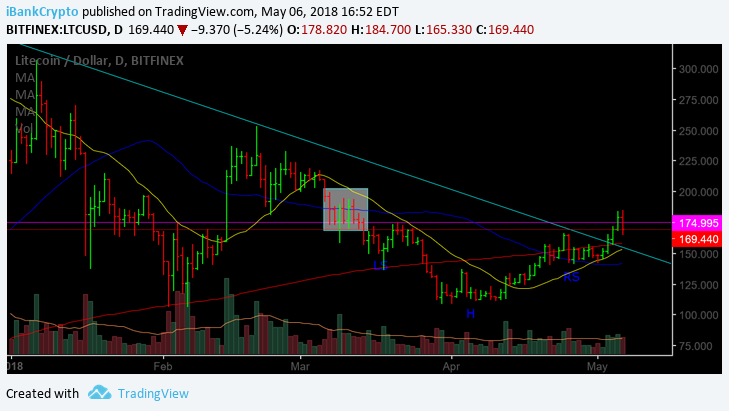
As we can see above, LTC has broken back above its downtrend line (light blue line) and in the process, has now recaptured its 200-Day moving average (red line). In addition, we can also see that LTC is presently trading above both its 20DMA (yellow line) as well as its 50DMA (blue line) respectively, which portrays a healthy technical posture.
Furthermore, we can also witness that LTC appears to be nearing a successful move out of its inverted Head-and-Shoulders (H&S) pattern (Bullish), although, a bit more work remains before we can declare such move a complete success, whereby if LTC can go top-side of the $175 level (Neckline) and ‘stick’, such development would go a long way in declaring the recent move victorious.
Nevertheless, from a technical point of view, the picture has certainly improved for LTC, yet, there remains a congestion zone (highlighted shaded box) that will need contending and to be overcome in the days/weeks ahead if LTC is to find further upside momentum.
Thus, moving forward, both investors/traders may want to pay particular attention to the following levels for further evidence/clues with respect to direction.
If LTC can clear the Neckline (purple horizontal line) at roughly the $175 level and can ‘stick’, the next level of contention is located at the $199.40 figure. Should both levels be cleared at any point in the days ahead, such development, should it materialize, would certainly indicate that LTC has regained its mojo and northern trajectory.
With respect to the potential short-term support, both the $158 level (200DMA), as well as the $142 figure, are areas where LTC should find a lending hand.
Nonetheless, both investors/traders may want to consider monitoring the action in LTC in the days/weeks ahead.
Happy Trading!
For the latest cryptocurrency news, join our Telegram!
Disclaimer: This article should not be taken as, and is not intended to provide, investment advice. Global Coin Report and/or its affiliates, employees, writers, and subcontractors are cryptocurrency investors and from time to time may or may not have holdings in some of the coins or tokens they cover. Please conduct your own thorough research before investing in any cryptocurrency and read our full disclaimer.
Image courtesy of Pexels
Chart courtesy of tradingview.com
The post Litecoin (LTC) Technical Analysis – LTC Breaks Above Downtrend Line – Recaptures 200DMA appeared first on Global Coin Report.

Globalcoinreport.com/ is author of this content, TheBitcoinNews.com is is not responsible for the content of external sites.
Our Social Networks: Facebook Instagram Pinterest Reddit Telegram Twitter Youtube


